Do you know where I should look in the DataBlock API to use an arbitrarily-channeled input? E.g. if I wanted to make a Siamese network where the images were stacked on top of each other instead (6 layers).
ok thank you very much
Hi @sgugger, when I use Resize(224, method=‘squish’), the squish resize is applied to both train and validation images? It is also applied in learn.predict, or should I manualy resize the test images before predicting?
Yes, the method is the same for training and validation sets. Especially since squish is not random.
Thanks!
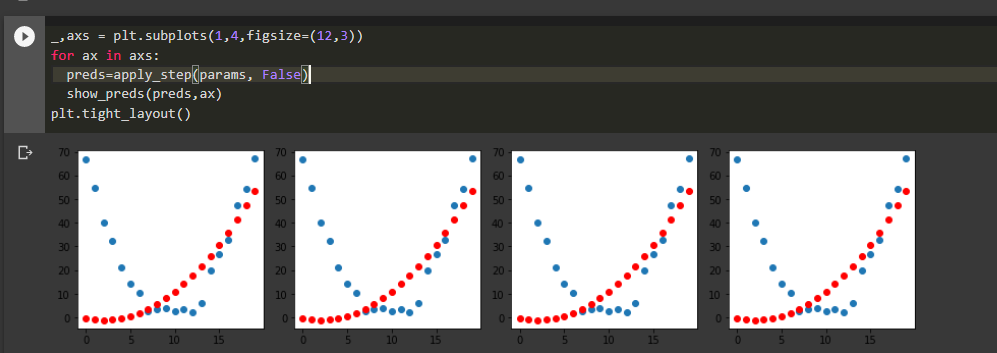
When scaled up, why is that only one half of the predicted curve appears to adjust and not the other half?
Thanks,
Hi @paulsolomon,
you’re right about ImageClassifierCleaner (): if the destination class directory has an image with the same name, it fails. I just checked that out.
To correct the code, change the line
for idx,cat in cleaner.change(): shutil.move(str(cleaner.fns[idx]), path/cat)
by the following code (cc @jeremy and @sgugger):
for idx,cat in cleaner.change():
    real_dst = os.path.join(path/cat, cleaner.fns[idx].name)
    if os.path.exists(real_dst):
        old_file_path = cleaner.fns[idx]
        old_cat = old_file_path.parent.stem
        new_file_path = f'{path/cat/old_cat}_{str(old_file_path.name.replace(" ","").lower())}'
        shutil.move(str(cleaner.fns[idx]), new_file_path)
    else:
        shutil.move(str(cleaner.fns[idx]), path/cat
3 Likes
Looking at the trick of adding sum() to compute the derivative of a function at multiple points, two thoughts came to mind.
- How obvious is it to the general audience that the result gives indeed the desired collection of derivatives?
- The
backwardfunction takes agradientargument (the “vector” in the “vector-Jacobian product” thatbackwardactually computes), and populating it with1.s gives precisely the collection of derivatives.
Roughly speaking, the difference between the two approaches is the order in which summation and differentiation are performed.
I wrote a post to explain these two points (using fastpages, which I find phenomenal!)
1 Like
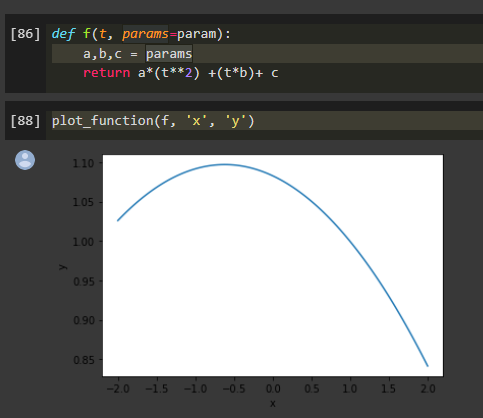
Looks like a bias term is missing in the predicted quadratic function, but not sure 
1 Like
Yeah maybe, that makes sense. Will checking it through.
While plotting the function using plot_functions() it is a parabolic structure. (without calculating gradient)
But after calculating preds, it looks as if the negative half of the curve is cropped.
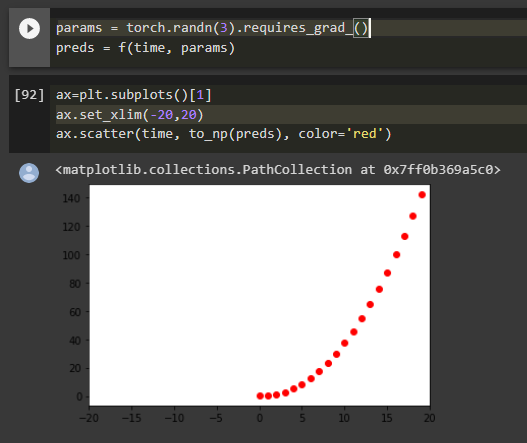
Why is that happening? 
1 Like
Probably because time starts from 0. That’s how it is in the original notebook (arange(0,…)) , so I am guessing that’s what you did too.
1 Like
Yeahhh didn’t notice that…my bad.
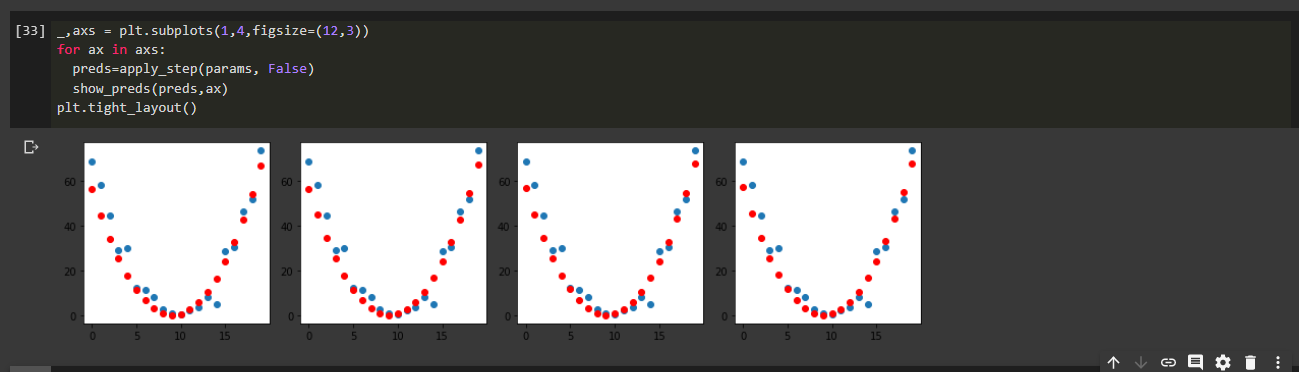
Now it works fine after changing the equation to: a*((t-9)*2) + (b(t-9)) + c
Had to loop through for 40 times but worked perfectly well.
Thanks,
1 Like
are you sure? grayscale images are just 1 channel images right? 0 for dark 255 for white or vice-versa?
1 Like
Yes, PILImageBW creates a 1 Channel grayscale Image.
3 Likes
I tried the SGD end-to-end example, by using 50 time points instead of 20 and the loss didn’t narrow down.
Is there any limit ?
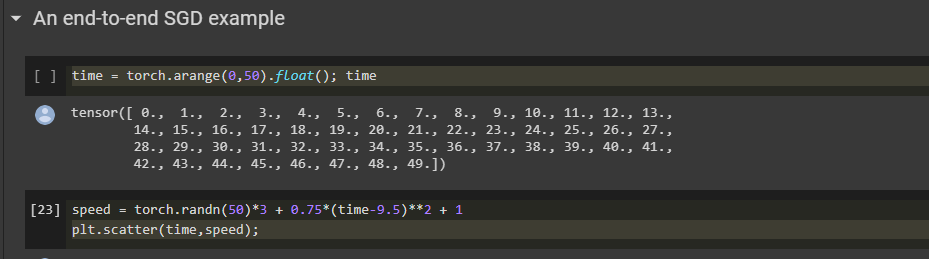
And the loss increased badly.
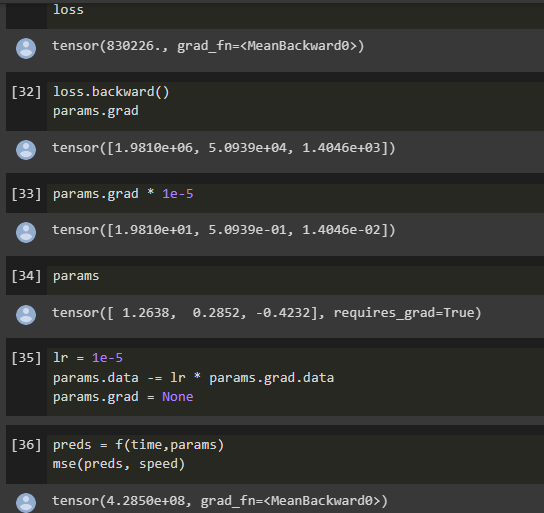
Why is this happening in the case of 50 divisions?
Thank you,
Great post Antoine, thank you 
Hey,
I can’t understand this:
his can be represented as a function and set of weight values for each possible category, for instance the probability of being the number eight:
def pr_eight(x,w) = (x*w).sum()
Considering that a probability must be a number from 0 to 1 I can’t understand why summing up the multiplication of x and w would generate a valid probability.
The * is element-wise multiplication. So the result of x*w is a vector or rank-one tensor. So the sum() ensures that the output is a number and not a tensor (of rank > 0).
Yes, I get this part but let’s say that the W is a tensor [1,2] and x is [1,1] so suming result would be 3 which is not a valid probality. What I don’t understand is why this sum is a valid probality.