I think traditionally it comes from ‘logistic regression’ and the use of the ‘sigmoid function’ (if you want to dig a bit deeper you can have a look at those terms).
Most of the time you would not predict ‘high’ and ‘low’ values but (something that we interpret as) probabilities, so values between 0 and 1. The question the model then tries to answer is 'Is the given image a 3?" and the prediction 0.8 would mean that the model is 80% sure that the image is a 3.
A way to get from arbitrary values to values in [0,1] is the sigmoid function which looks like this:
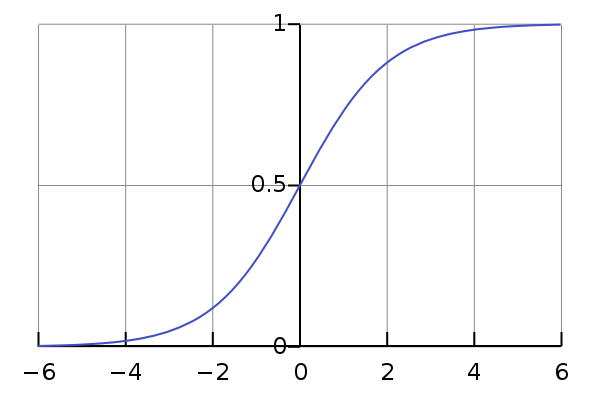
The larger the value you put into the function, the closer the result is to 1 and the ‘higher the probability’ that the image is a 3. Same for lower / close to 0 / not a 3, so a 7.
Now the threshold you would pick here most likely is 0.5. If the prediction is 0.49 that means 49% it’s a 3, 51% it’s a 7, so we obviously go with the 7. The twist is: which value do we need to put into the sigmoid function to land at 0.5? - Thats 0! So we can spare ourselves all that sigmoid business and just say: “values above 0 are label 3, lower than 0 are label 7” ![]()
Hope that makes sense ![]()