Lesson 3 camvid show_batch() problem

I was learning lesson3-camvid.ipynb, all outputs of the previous steps seem correct except when running the following line of code:

data.show_batch(2, figsize=(10,7), ds_type=DatasetType.Valid)

the output shows several images, but they all look the same:

no matter how many time i ran the code or change the rows to show.
:worried::worried::worried:

Here is the notebook with strange output that i wrote according to the original notebook, if anywhere was wrong, could you please do me a favor to point it out ?

some of the codes is as follows:

%reload_ext autoreload
%autoreload 2
%matplotlib inline

from fastai.vision import *
from fastai.callbacks.hooks import *
from fastai.utils.mem import *

path = untar_data(URLs.CAMVID)

path_lbl = path/'labels'
path_img = path/'images'

fnames = get_image_files(path_img)
lbl_names = get_image_files(path_lbl)

img_f = fnames[0]
img = open_image(img_f)
get_y_fn = lambda x: path_lbl/f'{x.stem}_P{x.suffix}'
mask = open_mask(get_y_fn(img_f))

src_size = np.array(mask.shape[1:])

codes = np.loadtxt(path/'codes.txt', dtype=str)
size = src_size // 2
bs = 4
src = (SegmentationItemList.from_folder(path_img)
       .split_by_fname_file('../valid.txt')
       .label_from_func(get_y_fn, classes=codes))
data = (src.transform(get_transforms(), size=size, tfm_y=True)
        .databunch(bs=bs)
        .normalize(imagenet_stats))

data.show_batch(2, figsize=(10, 7)) # different outputs every time

data.show_batch(2, figsize=(10, 7), ds_type=DatasetType.Valid)  # outputs always look the same

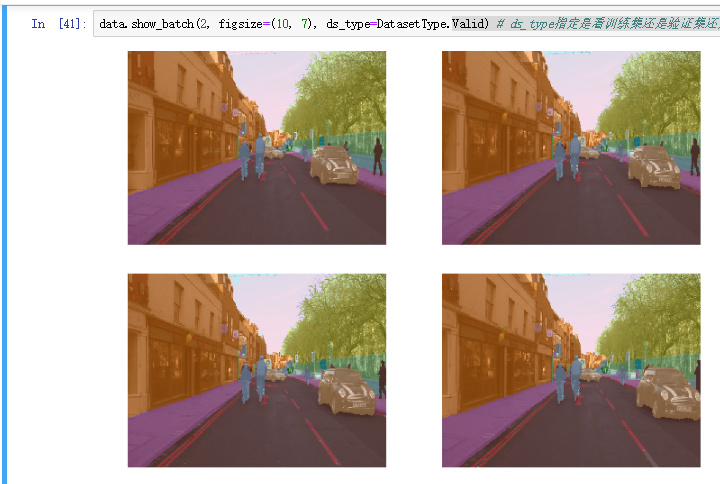
If you look at the gentleman on the far right of the screen (he is outlined in black) you can see they are in-fact different photos :slight_smile: Just they were taken milliseconds apart! This is due to show_batch() grabbing the first ‘x’ photos in its dataloader. If we assume this is car data continuously being gathered, this behavior would make sense wouldn’t it?

Thanks for your quick reply! I used to understand the output as the same way as you said, but it’s more than that. Let me tell you 3 more things:

  1. Every time i ran the previous line of code:
data.show_batch(2, figsize=(10, 7)) 

it gave me different images to show. but when i ran

data.show_batch(2, figsize=(10, 7), ds_type=DatasetType.Valid)

the output is always look the same…

  1. when i ran
learn.show_results(rows=3, figsize=(10, 10))

I also got strange result, the first row of output is blank, and the second row is still the same image as above. Also i didn’t get 3 rows of results.

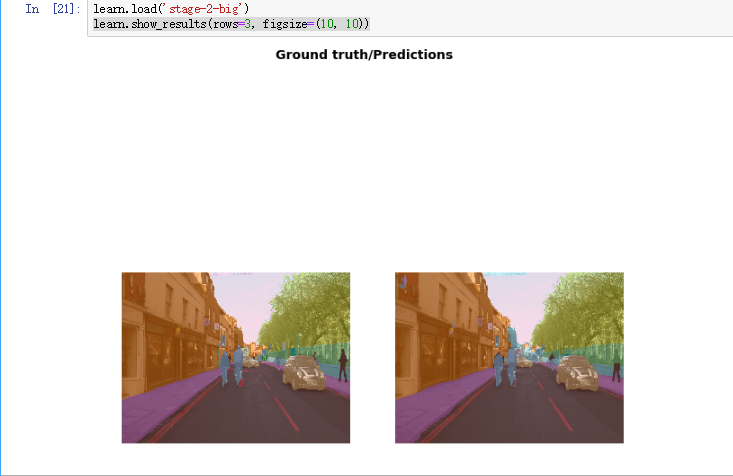
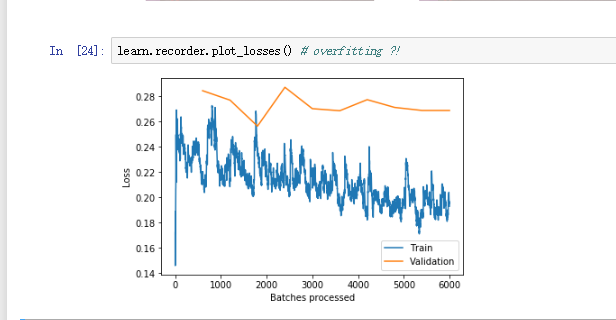
3)Jeremy said in the video that the accuracy(acc_camvid) is hard to reach more than 92.5%, but I got(Strange, isn’t it?). Only it seems that I got overfitting problem?

How can we prevent this or identify a just “right”(not underfit or overfit) result ? Is it the time when train loss is equal to valid loss?

show_result_error3

:cold_sweat::cold_sweat:

Interesting. I’m wondering if specifying the ds_type resets the tracker for show_batch(). As to the second, I’m not 100% sure as the reasoning for that.

Thanks. I have uploaded the notebook with strange output which i wrote according to the original notebook

Maybe the cause of the problem lies in the dataset I downloaded (but I didn’t know why…:worried:, I thought everyone downloads the same dataset), delete the dataset and run the notebook from beginning to end again may slove the problem. I rerun the code in colab and it got different results which seems better.