I am getting some weird LR graphs for the multi-label example.
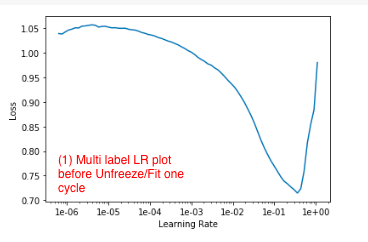
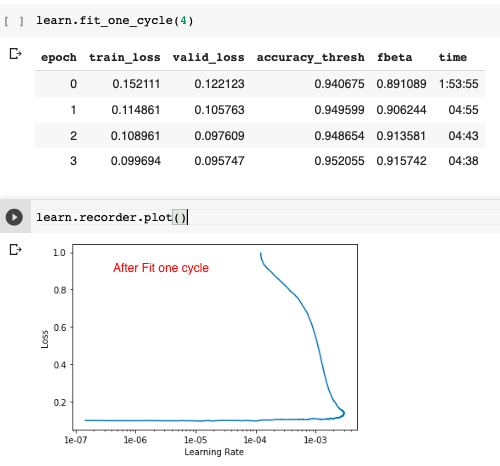
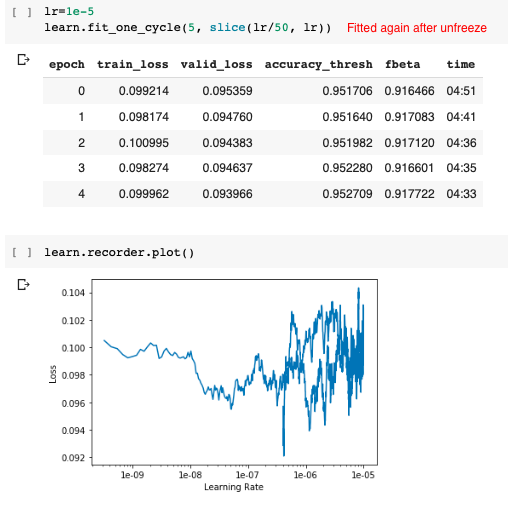
The strange thing is the results from validation set are very good! What’s happening here?
I am getting some weird LR graphs for the multi-label example.
The strange thing is the results from validation set are very good! What’s happening here?
I’m also a bit confused here. In particular, in the Camvid lecture, let’s say we start with a 104x102 image size, train the model, then upgrade our dataset to a 208x204 image size.
When I do this, the model architecture still describes itself as 104x102:
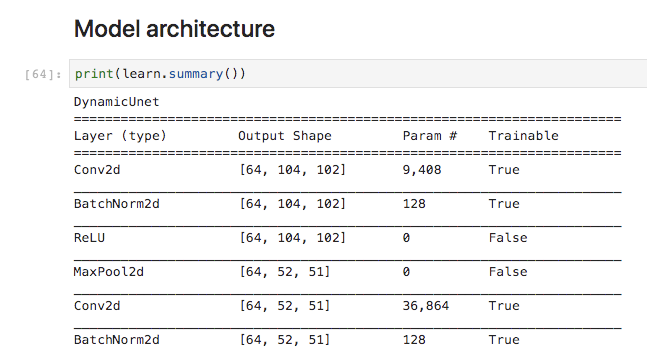
Is there a layer that is attached prior to the 104x102 layer that converts 208x204 into 104x102 that is not being printed in the architectural output? If so, how can we make that layer visible?
Correct, but it also says:
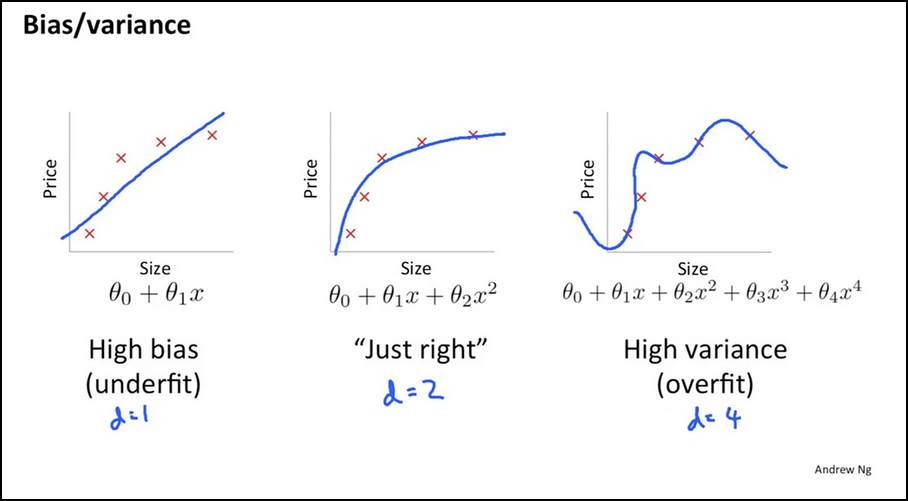
This emphasizes a major difference between
large- and small-size networks where for the
latter poor quality local minima have non-
zero probability of being recovered. Finally,
we prove that recovering the global minimum
becomes harder as the network size increases
and that it is in practice irrelevant as global
minimum often leads to overfitting.
Which seems to me like the curve on the right side.
That happened to me as well. It just takes time.
I would suggest to split the different parts to be able to see each one progressing individually.
In that particular dataset, the untar process takes a lot of time because there are many GBs of data to untar.
I ended up using this trick to ‘see’ it moving.
# !7z e train-jpg.tar.7z
# !tar  xf  test-jpg.tar --checkpoint=1000
tar: Write checkpoint 1000
tar: Write checkpoint 2000
tar: Write checkpoint 3000
....These are the plots I use on each stage.
They may give you what you expect to see.
def rec_plots_lrfind():
  learn.recorder.plot(suggestion=True)
  learn.recorder.plot_losses()
  learn.recorder.plot_lr()
  #learn.recorder.plot_metrics()

def rec_plots_fit():
  #learn.recorder.plot(suggestion=True)
  learn.recorder.plot_losses()
  learn.recorder.plot_lr()
learn.recorder.plot_metrics()Hi, is anyone else facing a issue when running lesson3 head pose notebook.
I am running this cell
‘’‘data = data = (PointsItemList.from_folder(path)
.split_by_valid_func(lambda o: o.parent.name==‘13’)
.label_from_func(get_ctr)
.transform(get_transforms(), tfm_y=True, size=(120,160))
.databunch().normalize(imagenet_stats)
)’’’
which thows an error: "
Exception: It’s not possible to apply those transforms to your dataset:
Expected object of scalar type Double but got scalar type Float for argument #3 ‘mat2’ in call to _th_addmm_out"
I tried googling the error but could not find a solution that works.
Any help is greatly appreciated.
Thanks
Path and FastAI Directory
When using fastai, you can create a path with
path = Config.data_path()/'planet/
The path created is then PosixPath(’/root/.fastai/data/planet’). What is this exactly? Where is it located? What do I need to do when say I want to create a path in my local machine? Or if I am using Google Colab, how do I create a new path?
I tried to read the documentation of Config which mentions that it will setup a config at ~/.fastai but where is this root folder located? The reason why I want to understand this is because when you’re using Google Colab, your session does not get saved. So it might be a good idea to download pre-trained model weights to local machine which you can upload later to continue training or tuning.
Thank you so much!
I solved this problem by specifying loss_func using ignor_index keyword argument when creating unet_learner, try this:
learn = unet_learner(**, loss_func=CrossEntropyFlat(axis=1,ignore_index = 255))