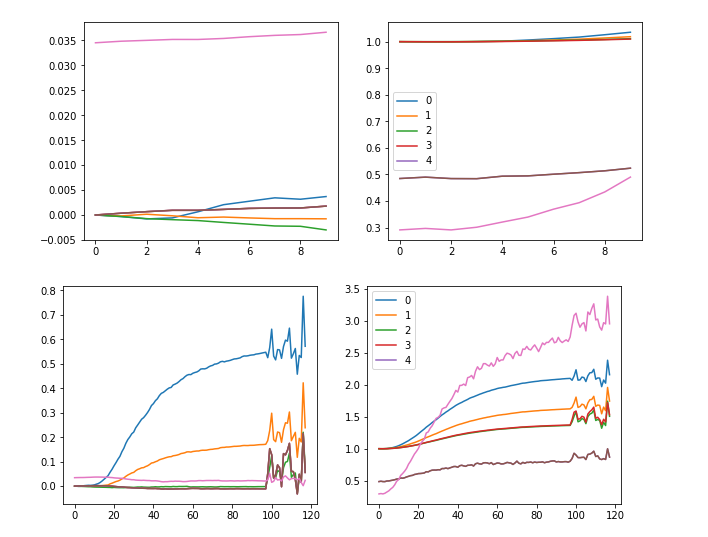
In lesson 10, when we plot act means of our non initialized network, we get act means that rise and fall.
The size of model.act_means is 7 and each list element is sized 236.
Each of these 236 activations is what we are plotting for each indiviual layer represented by different colours is my understanding. (please correct me if i’m wrong)
But what are these 236 activations, are they the activation after each mini batch?
if so then our training data is 50000 images divided by bs 512 times 2 epochs should be only 195, what is 236?
First of all, the number of data points along the horizontal axis is 216, not 236. Please check to see if you agree.
Your understanding is correct – each plot shows the series of activation mean (or std), for all the mini-batches. The 50,000 training examples are split into 98 mini-batches of 512 examples each (except for the last batch, which has fewer than 512 examples). Two epochs should therefore contain 196 mini-batches.
Why then do the plots show 216 data points along their horizontal axes? The reason (pointed out to me by @rekilprashanth) is that the 06_cuda_cnn_hooks_init.ipynb notebook erroneously includes the 10 mini-batches from the validation data in each epoch, which adds an extra 20 mini-batches, making a total of 216.
I’ve implemented the correction – suggested by @rekilprashanth – to the 06_cuda_cnn_hooks_init.ipynb notebook, available on my git repo, in which the .training property of model is used to select only the training data, and it produces plots with the correct number of n_{epochs}\times98 training mini-batches on the horizontal axis. Try it out yourself and let me know what you think!
hi thanks for replying. This does make sense, however for my notebook the size of model[0].act_means was 236, maybe i’m adding 20 mini batches from validation data.
Could u please point out where this error is occuring (which part of the notebook or which function is including validation data during training)?
I dont particularly care about fixing the issue, want to confirm if that is indeed waht is causing it and where the error occured. I’m rebuilding these just for practice anyway, so finding the mistake is way more helpful than finding the correct version
The place where I applied the corrections in the notebook is wherever they append to the means and standard deviations list. there are several places in the notebook where this happens