But V3 is different so the training perform differently. For now it’s worse, I’ve to learn more about the new API.
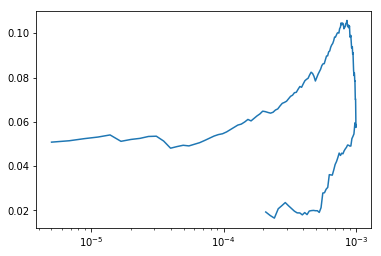
For example this plot is weird:
learn.recorder.plot() (Edit from Jeremy - turns out the plot isn’t weird; see below for details).
Let me know if you find this useful and like to work with me to improve it : Let’s fight Google together
@ecdrid think of a scatter plot but with connected points in the order that they occur (the index order). You can try this out for yourself with a numpy array
e.g.
plt.plot([0,1,-1,2,3] , [1,2,3,4,0])
vs
plt.scatter([0,1,-1,2,3] , [1,2,3,4,0])
That plot is indeed very weird, @ecdrid. You seems to be on to something. Pretty unlikely on the lrfinder() there are two logloss values for the same learning-rate, unless the lrfinder() is also doing a one-cycle-policy thing - the learning rate goes up then comes down
Thank you all for commenting, in fact it is not the graph of the lr_finder()
It is the graph after a learn.fit_one_cycle(cyc_len=epoch, max_lr=lr)
So it seems legit considering what 1cycle policy does : https://sgugger.github.io/the-1cycle-policy.html#the-1cycle-policy
Sorry to have warned you for nothing !
it’s a great notebook, with a great google-beating result ,and that plot is but a distracting side issue. I was just worried there’s a bug, and my future self might be seeing such a plot and be stunned.
I saw that both batch_size and image_size was redefine in a loop. How does the model weight react to the change of input size? I know there is an adaptive pooling layer at the end to guarantee the output size. Does the model weight simply upsample/downsample when we change the image input size?
for bs, sz, epoch in training_loop:
    data.batch_size = bs
    learn.fit(epochs=epoch, lr=lr)
Actually I may have missed it. When you said multiple images sizes, I was thinking how the model weight can adapt to take different input size. Then I notice the sz parameter was actually never used? I think you only change the batchsize.
You’re totally right, I forgot to allocate the size !
For your question about weights, it works because in convolution layer we do not weight the pixels, but the convolution mask, who did not change with the input size.
It’s a good question because with older network we need to use fixed input sizes.
I will update my code like that :
for bs, image_size, epoch in training_loop:
data.size = image_size
data.batch_size = bs
learn.fit(epochs=epoch, lr=learning_rate)
I just came across this thread since I was working on a similar problem. In my case, however, I’m trying a 5-class multiclass classification (Boeing 747, Boeing 777, Airbus A340, Airbus A350, Airbus A380), after having downloaded all of these from Google Images. The problem I’m facing - since the images get square cropped, a lot of the times, the main features of the airplane get cropped off, since most images are lateral. (as opposed to dogs vs. cats or dog breeds, where the majority of the features lie in the center of the image). From the V2 class, I remember Jeremy mentioning that padding with white space does not improve the model significantly. Does anyone have an idea as to how to overcome this?
I would be curious to know the approximate error rate you are getting now. In my opinion, the main features of these class of aircraft would be the nacelles and the profile of the airframe; and perhaps these features could still be picked up regardless of the cropping?
I’ve been tinkering with datasets of smaller planes (e.g. Cessna, Piper), and was surprised to see very low error rates (~2-4%) with almost no data cleaning.
I’m currently getting an error rate of around 33%. I believe that the nose, and the exterior of the cockpit area adds good signal to the model. Cessnas and pipers are relatively lower in length, and have distinguishing features to separate them. For these bigger planes, the nacelles do provide good information, but I think the nose area in general make them more distinguishable. To be fair, I have 50 images of each, so 40 goes into training and 10 goes into validation. I should also probably find more images to add to my dataset. I’ll keep you updated on how I progress. I should probably add Cessnas and other smaller aircrafts too to my dataset. How many images are you using?


 :
: