in Lecture 6 @ 1:07:55 Jeremy discusses how the first two parameters in
xs = torch.linspace(0.05,0.95,29)
0.05 and 0.95 is the range that torch.linespace() will plot data. but what is the 29 doing in the parameter?
in Lecture 6 @ 1:07:55 Jeremy discusses how the first two parameters in
xs = torch.linspace(0.05,0.95,29)
0.05 and 0.95 is the range that torch.linespace() will plot data. but what is the 29 doing in the parameter?
It’s steps - size of the constructed tensor
https://pytorch.org/docs/stable/generated/torch.linspace.html
@miwojc Got it!!!
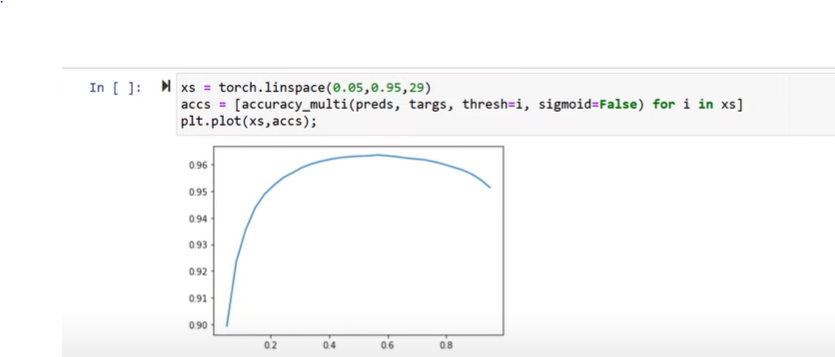
One thing that I am trying to intuitively understand is that when Jeremy ran the
torch.linespace()
get ot the following graph
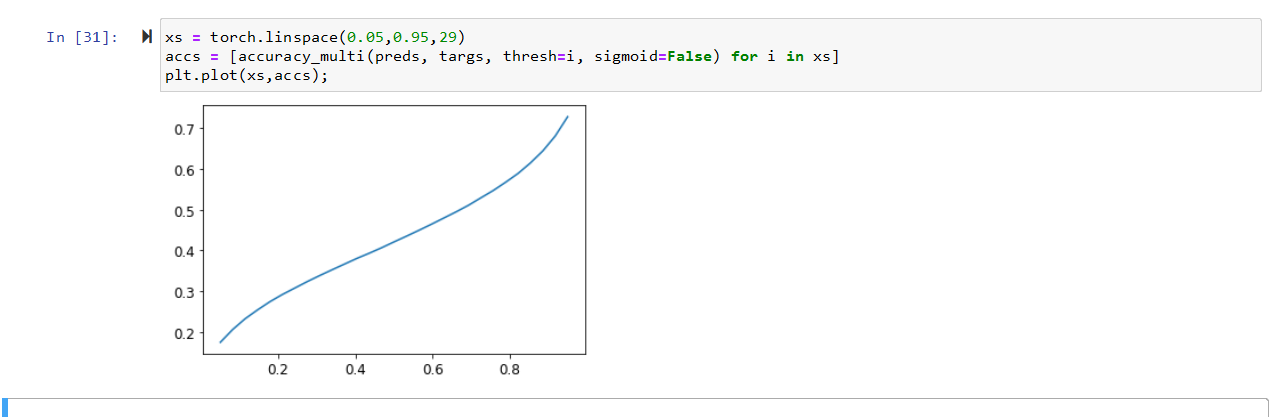
I however got this graph when I ran it.
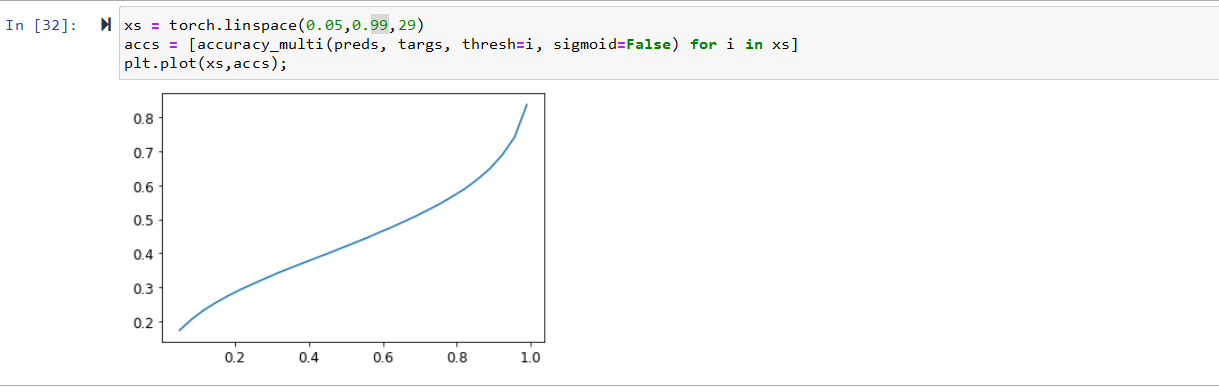
When I raise the max threshold to 0.99 the curve looks like it could go higher
unclear why I am getting a different graph.
any insights would be greatly appreciated!!!
your predictions, target are different?