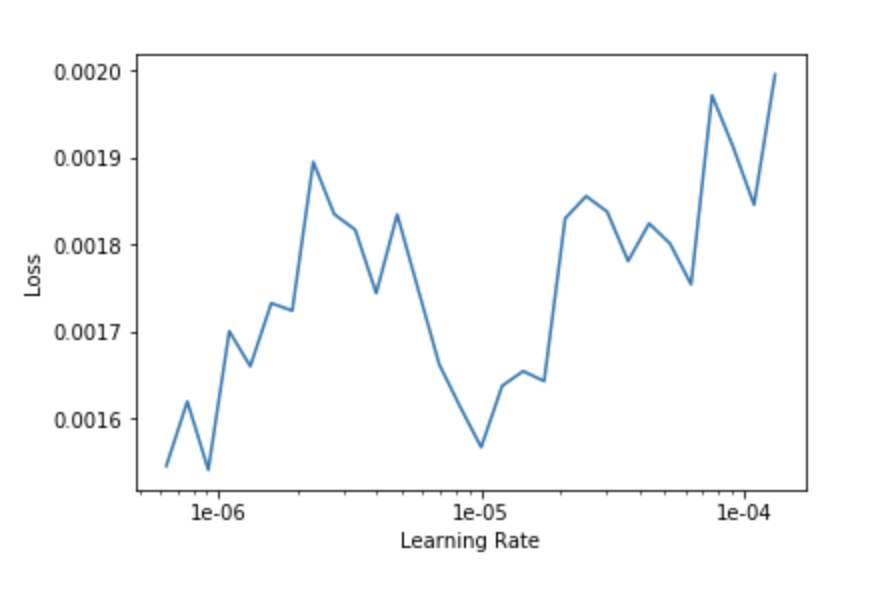
I am training this Kaggle fruits dataset to train a mutli-label classification model. I chose a resnet34 CNN, chose my learning rate using lr_finder, trained for 5 epochs using fit_one_cylce, unfreezed, then plotted the learning rate again. This is the curve I get. I haven’t seen anything like this before … Anyone knows what it means if it’s so jaggedy?
1 Like