Hello,
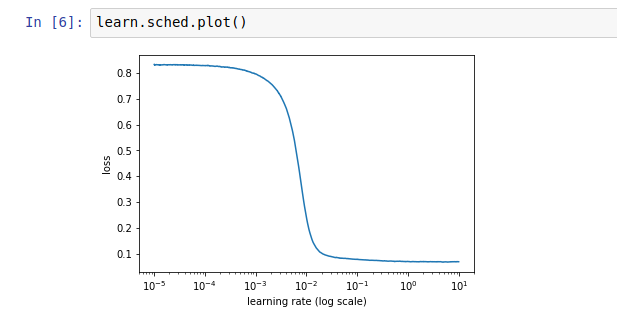
I’ve used lr_find() to find a suitable learning rate but I got the graph below.
In this case what learning rate should I choose ?
Hello,
I’ve used lr_find() to find a suitable learning rate but I got the graph below.
In this case what learning rate should I choose ?
Your loss is already quite low to begin with. Is this a model that has been trained already?
Yes, the model has already been trained but the accuracy is low (around 49%).
It’s a multilabel image classier.
I’ve followed the steps from lesson 1 and 2
Review: easy steps to train a world-class image classifier
Enable data augmentation, and precompute=True
Use lr_find() to find highest learning rate where loss is still clearly improving
Train last layer from precomputed activations for 1-2 epochs
Train last layer with data augmentation (i.e. precompute=False) for 2-3 epochs with cycle_len=1
Unfreeze all layers
Set earlier layers to 3x-10x lower learning rate than next higher layer
Use lr_find() again
Train full network with cycle_mult=2 until over-fitting
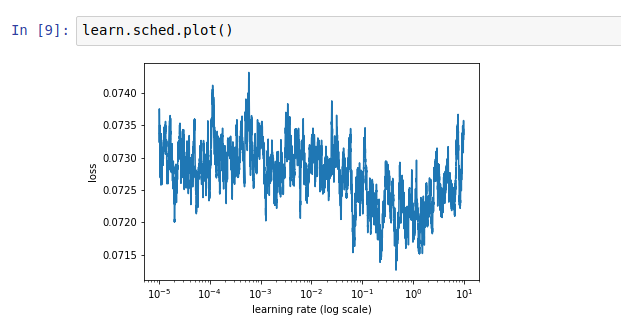
I’m now on step 7 (the second lr_find() ).
The first lr_find was pretty obvious (see attached).
Was it said that the trained model shouldn’t be used to calculate LR again?
May be I missed something.
Could you explain your thought ?
I began using resnet50 as a base model.
Did lr_find()
Trained for 4 epochs
Trained for another 4 epochs with precompute=False
Unfreezed all layers
Used lr_find() again and here I got the plot
In both cases you didn’t go far enough to find the good LR: on both your first graph we don’t get the part where the curve goes up again. In the second one, it’s logical to have something flat at the beginning (the variations we see have a 0.002 amplitude) because your network has been pretrained.
I’d run the LR Finder with end_lr=100 or 1000 to get a clearer curve.
Thank you. I’ll give it a try.