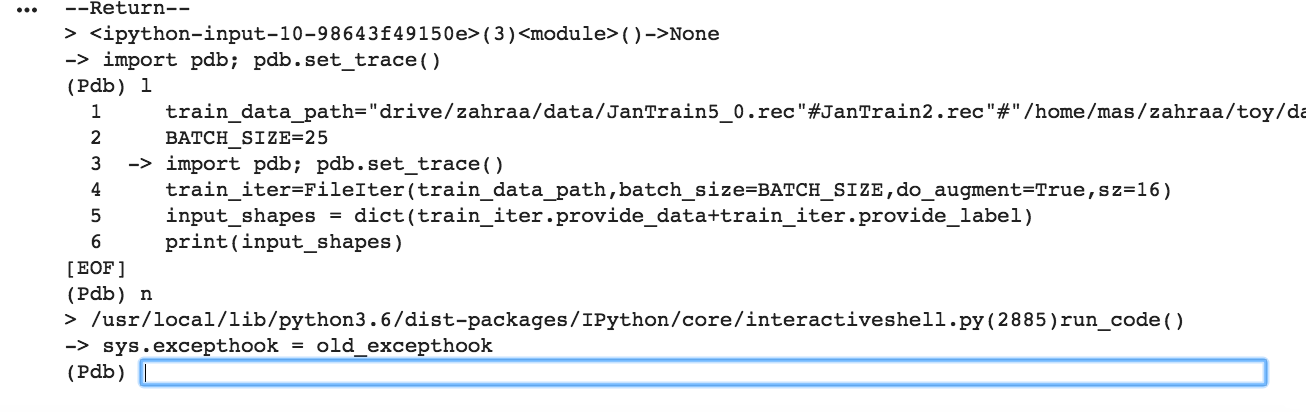
This is what I get when I use the pdb:
Not sure what is causing the problem. I tried to use the builtin debugger as below, but I run into the same issues.
import IPython.core.debugger
IPython.core.debugger.set_trace()
This is what I get when I use the pdb:
Not sure what is causing the problem. I tried to use the builtin debugger as below, but I run into the same issues.
import IPython.core.debugger
IPython.core.debugger.set_trace()
AFAIK pdb.set_trace() shows the contents of current stack where it’s called, and since it was called in global scope it looks like it’s inspecting its own code after n is entered.
Try wrapping the stack trace call inside a method and see how it works out. Code example given here
Usually it’s better to put a traace where in a method / call that’s not working as expected, or use %debug as mentioned in lessons. For checking other values, you can just check them in REPL itself using print like you’re checking input_shapes in the code.
when adding it to FileIter (class), it only throws an exception. No pdb box appear. I managed to debug the problem using %debug, but it would have been nice if I was able to step into the code using pdb.