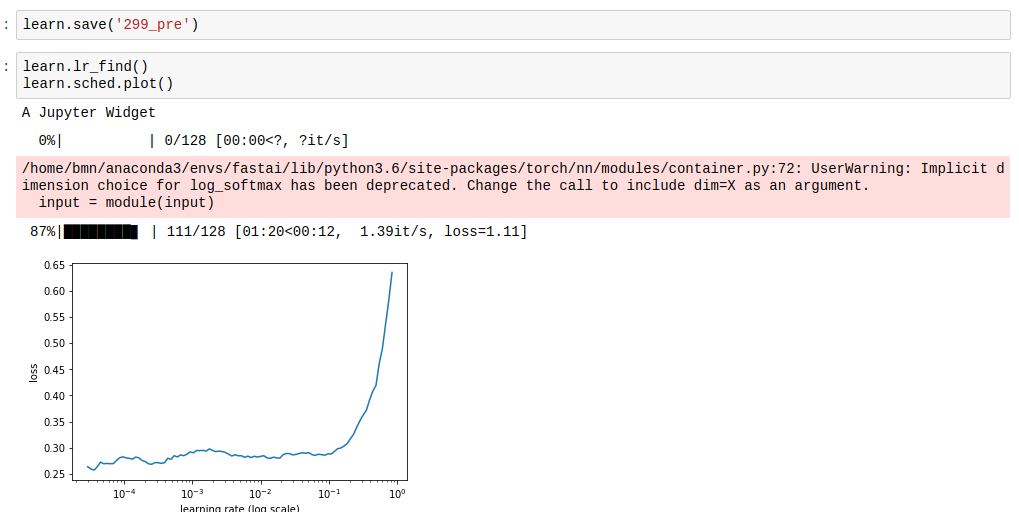
In lesson 2, @jeremy introduced the resnext50 architecture, which seemed to perform really well, in line with what I saw in the video, until I used the learning rate finder. The plot is very different, almost inverted. Can anyone tell me why this is the case?
Maybe the model is virtually fully trained when you run the learning rate finder and all that can happen is it can get worse?
That’s what I sort of read from this graph - we seem to be in some nice valley with low loss, but then as steps that we take reach certain size we manage to jump from one side of the valley to another and parkour style jump out  (though that is probably not how it works in many dimensions)
2 Likes
Can you should the whole notebook? It is important to understand how much have you trained, how many layers are you training etc…
3 Likes
Hello @yinterian, here’s the current state. Sorry about the rendering of progress bars. Also, I cloned the dogs vs cats notebook to make this one, so everything after the lr.find() section will be from a different notebook. https://nbviewer.jupyter.org/github/poppingtonic/fastai/blob/poppingtonic-qn/courses/dl1/Personal%20Notebook%20-%20Lesson%201-Dogbreed.ipynb
When you restart your kernel the progress bars tend to get fixed.
What I believe is that you are training for a while and then running learn.lr_find(). learn.lr_find() should be used in the opposite way, you first run it and get an idea on the right learning rate. Maybe then you unfreeze (either all or partially) and run learn.lr_find() again before fitting.
After you run for a while the loss function gets to a kind of “plateau” and that is what you are seeing.
2 Likes
I see! I’ll try this and post my results.