SO in the pet breed classification chapter where we study about fine tuning our models in detail, ‘lr_find()’ is used primarily to plot a graph. My question is if the goal is to minimise the loss, why did jeremy take values far from the minimum when there is clearly a lower loss region in the left side of the graph. I get that selecting the lowest point means that no more training is possible, but we can select a range encompassing that lowest loss region right? I do not know if I was able to explain my question correctly.
You should read this: on how the Learning Rate Finder is implemented. It involves smoothing out the loss curve by using the previous losses and current losses to make the avg loss. Meaning, at the minimum point is also too late. The loss may have already start getting worse but the average won’t reflect that for some time.
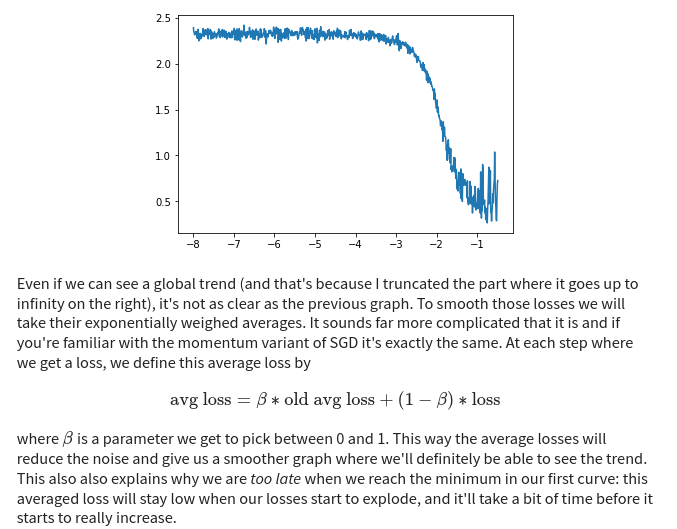
Link to blog post: https://sgugger.github.io/how-do-you-find-a-good-learning-rate.html#how-do-you-find-a-good-learning-rate