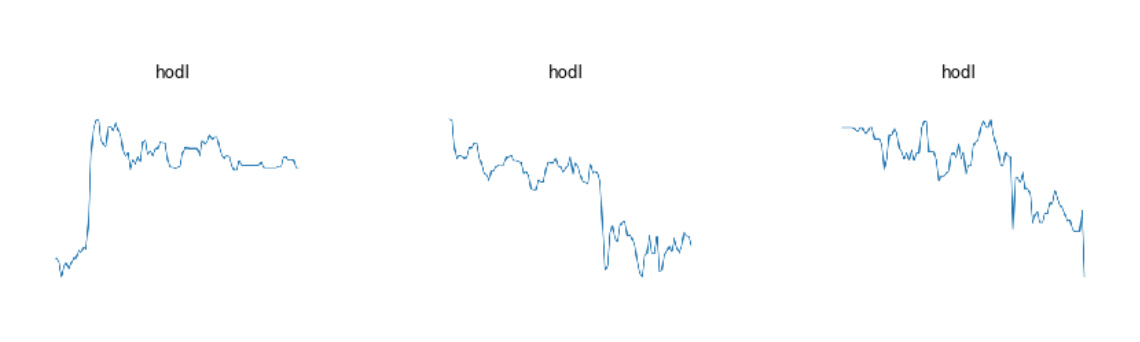
I’m going through lesson one and I have created an image set of bitcoin price charts in 5 minutes steps over the last three month and my goal is to predict when the market goes into price fluctuation panic.
I know that this probably won’t earn me millions, but it’s fun to experiment.
Each image is labeled hodl (the price does not change in the next 5/10/15 minutes), bear (the price drops in the next 5/10/15 minutes)and bull (the price raises in the next 5/10/15 minutes).
Since there are a lot more sideway movements than price changes I have:
21654 hodl sets
2195 bear sets
1971 bull sets
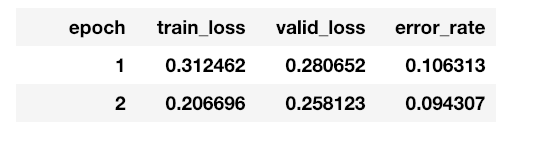
The net clocks in at an error rate below 10 percent. That’s sounds a bit too good to be true. I wonder if that comes from the fact that there are way more hodl sets and it just “accidentally” get’s a lot of those right, because it’s so likely to predict that correct:
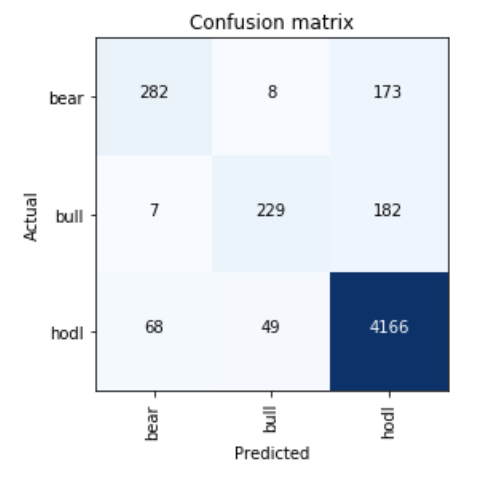
The confusion matrix does not look too bad. It rarely confuses bear and bull, but there is a significant confusion with bear / hodl.
I’m struggling a bit to make sense of wether this is now a model that performs reasonably well (it basically has to beat the 0.25% trading fee in the long run) or if I’m just not interpreting the metrics correctly?
How to interpret the train / valid loss and what loss value is even a good one?
Note that I’m doing this just for learning, I don’t expect to make a lot of money here :-).
Hi chp. I’ll go out on a limb here and comment, given that you don’t include many details. Please forgive if some of these points are obvious. I am also a beginner with ML. But I spent years for hire implementing various traders’ grand ideas in TradeStation. None of them worked.
There’s a big difference between categorizing bull/bear/hodi charts, and predicting them in the future. If your model performs this well predicting, you’ll be rich. If you’re recognizing chart shapes, meh. You can do a lot better than 90% categorizing charts using very simple numerical algorithms on price series. Maybe you are conflating “predicting” by a model and predicting future price movements.
It’s very easy to let future prices leak back into a prediction algorithm. Even the best coders and languages are susceptible. You have to be extremely careful that at the moment of prediction the model has seen not even a bit of information from the future of that moment. HFT trading firms were once making mega-fortunes just by seeing a couple of milliseconds into others’ future actions.
The ultimate and necessary verification of a prediction algorithm is hook it to an actual trading method. Then paper trade in real-time on price data that did not even exist at the time you made the algorithm. Yes, you can simulate real-time trading, but there’s still the small risk that your method is peeking into the future, and you or your client will lose a pile of money.
AFAIK, the absolute numbers for losses are not important in themselves. What matters are the relative values for training and verification loss (to detect overfitting), and whether validation loss is still decreasing.
HTH, and sorry if parts are not pertinent to your question. Good luck!