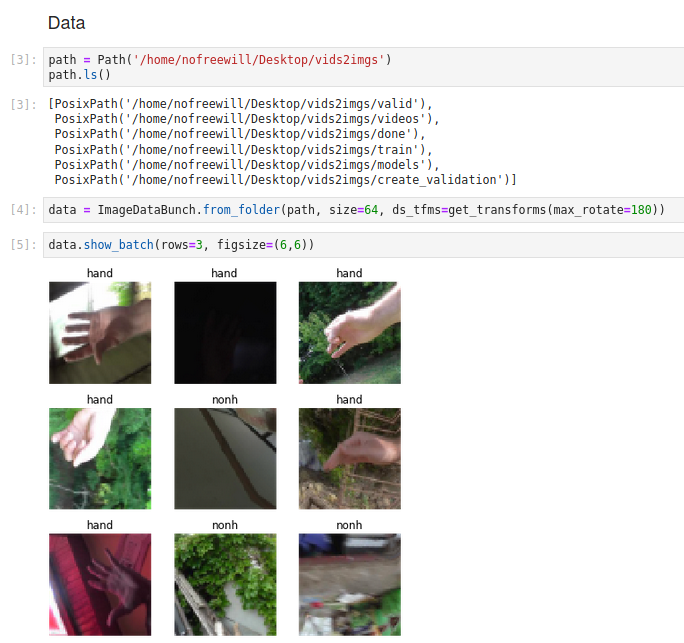
I have downloaded images from google images, Here is my folder structure. Please note that I just have a train folder and no valid and no test folders.
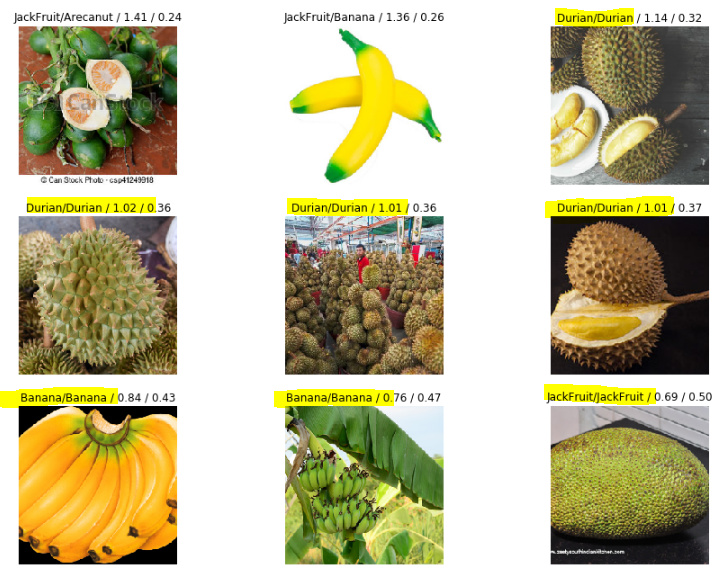
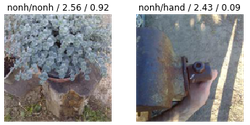
After I train and try to plot losses (using `interp.plot_top_losses’), I get some inconsistent results. See below.
Remember that loss is not just accuracy, but confidence in the prediction. The text in plot_top_losses is prediction/actual/loss/probability. The cases you highlighted are ones where the model is making the correct prediction, but doing so with low confidence, leading to a higher loss.
It just mean there are very few misclassified examples. In this case only four, and when asking for 9 pictures, the fastai library pulls out the 5 correctly classified with the bigger loss e.g. the less confidence.
What is the probability of ?
in the first image 0.24 means its 24% confident out of all the other classes?
If so, that means the other classes confidence should be less than 0.24 ?
I am not able to understand the concept of probability
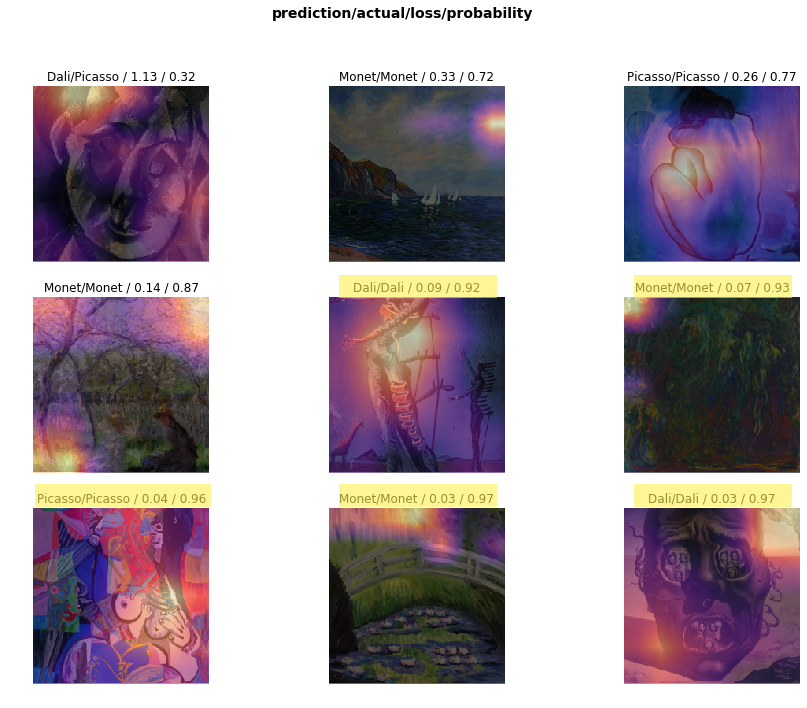
The latest version of fastai seems to have an issue with plot_top_losses().
Heatmap does not come up with interp.plot_top_losses(9,figsize=(15,15),heatmap=True,heatmap_thresh=16)
I am running the notebook on colab.
Further Update:
Heatmap shows up at heatmap_thresh below 5.Actual value of heatmap_thresh does not have any bearing between 0 and 4. Further on some images there is no heatmap at all even though the classification is accurate with probability above 90%. How reliable is the heatmap to estimate whether the model is looking for relevant things in the image??
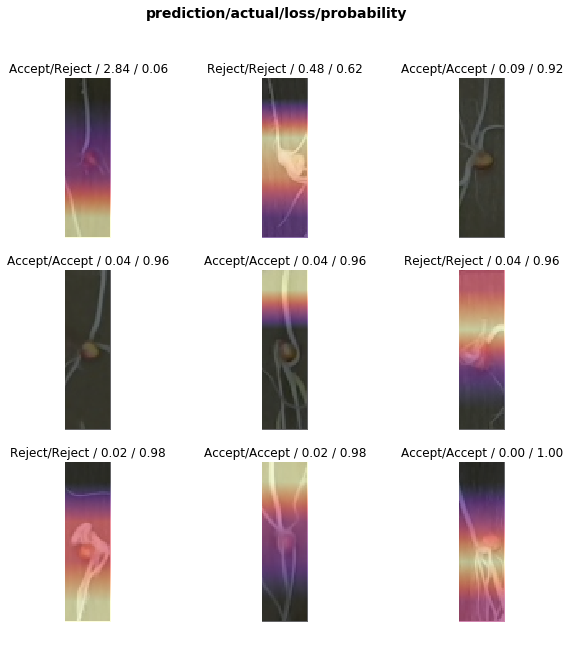
As I have two classes I think that in my case a higher “confidence” should be accompanied by a lower loss, but this is not the case as you can see on the picture. Or is the loss function not the cross entropy by default?