Feature Request: I think that plots could be improved, especially the recorder.plot_loss() is missing a lot. If you agree, i will make an merge request.
Improves for plot_loss():
- naming the axes
- adding a title
- adding vlines to indicate epochs
- possibility to plot logarithmic scale (as requested here)
- possibility to add an existing axis and return the axis for further customization*
*this should be standard for all plot functions. as many other libraries to this, for example darts
Improved code:
def plot_loss(self, skip_start=5, with_valid=True, log=False, show_epochs=False, ax=None):
    if not ax:
        ax=plt.gca()
    if log:
        ax.loglog(list(range(skip_start, len(self.losses))), self.losses[skip_start:], label='train')
    else:
        ax.plot(list(range(skip_start, len(self.losses))), self.losses[skip_start:], label='train')
    if show_epochs:
        for x in self.iters:
            ax.axvline(x, color='grey', ls=':')
    ax.set_ylabel('loss')
    ax.set_xlabel('steps')
    ax.set_title('learning curve')
    if with_valid:
        idx = (np.array(self.iters)<skip_start).sum()
        valid_col = self.metric_names.index('valid_loss') - 1
        ax.plot(self.iters[idx:], L(self.values[idx:]).itemgot(valid_col), label='valid')
        ax.legend()
    return ax
Sample usage:
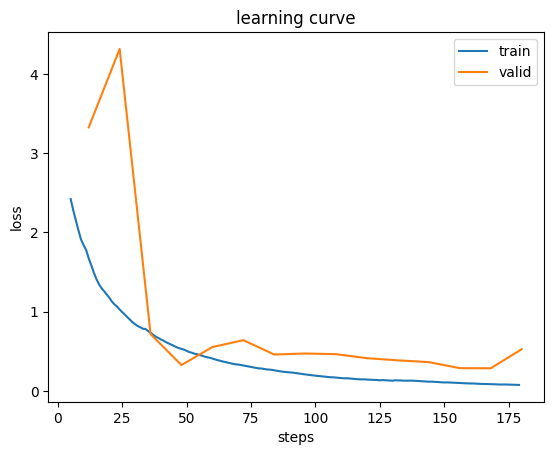
# example 1 (backwards compatible)
learn.recorder.plot_loss()
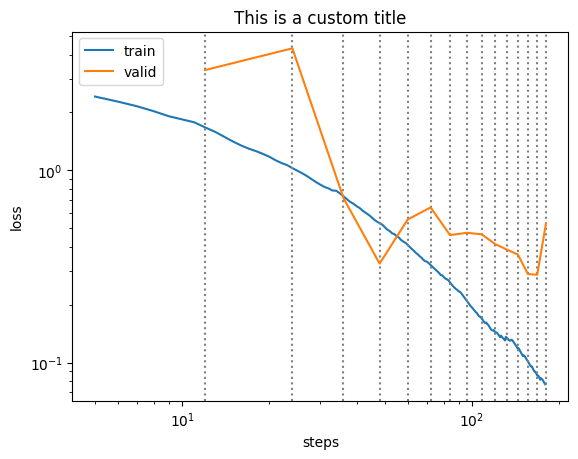
# example 2 (new features)
fig, ax = plt.subplots()
learn.recorder.plot_loss(log=True, show_epochs=True, ax=ax)
ax.set_title('This is a custom title') # further customization
Example 1:
Example 2:
Issue: