cmap='tab20'
fig,axes=plt.subplots(1,2,figsize=(sz,sz))

#image
im=axes[0].imshow(image2np(t),cmap=cmap)

#labels
c = len(classes)
n = math.ceil(np.sqrt(c))
axes[1].imshow(np.array(range(c)).reshape(n,n), cmap='tab20')
for i,l in enumerate(classes):
    div,mod=divmod(i,n)
    axes[1].text(mod, div, f"{l}", ha='center', color='white', fontdict={'size':sz})
axes[1].set_yticks([]);axes[1].set_xticks([]);
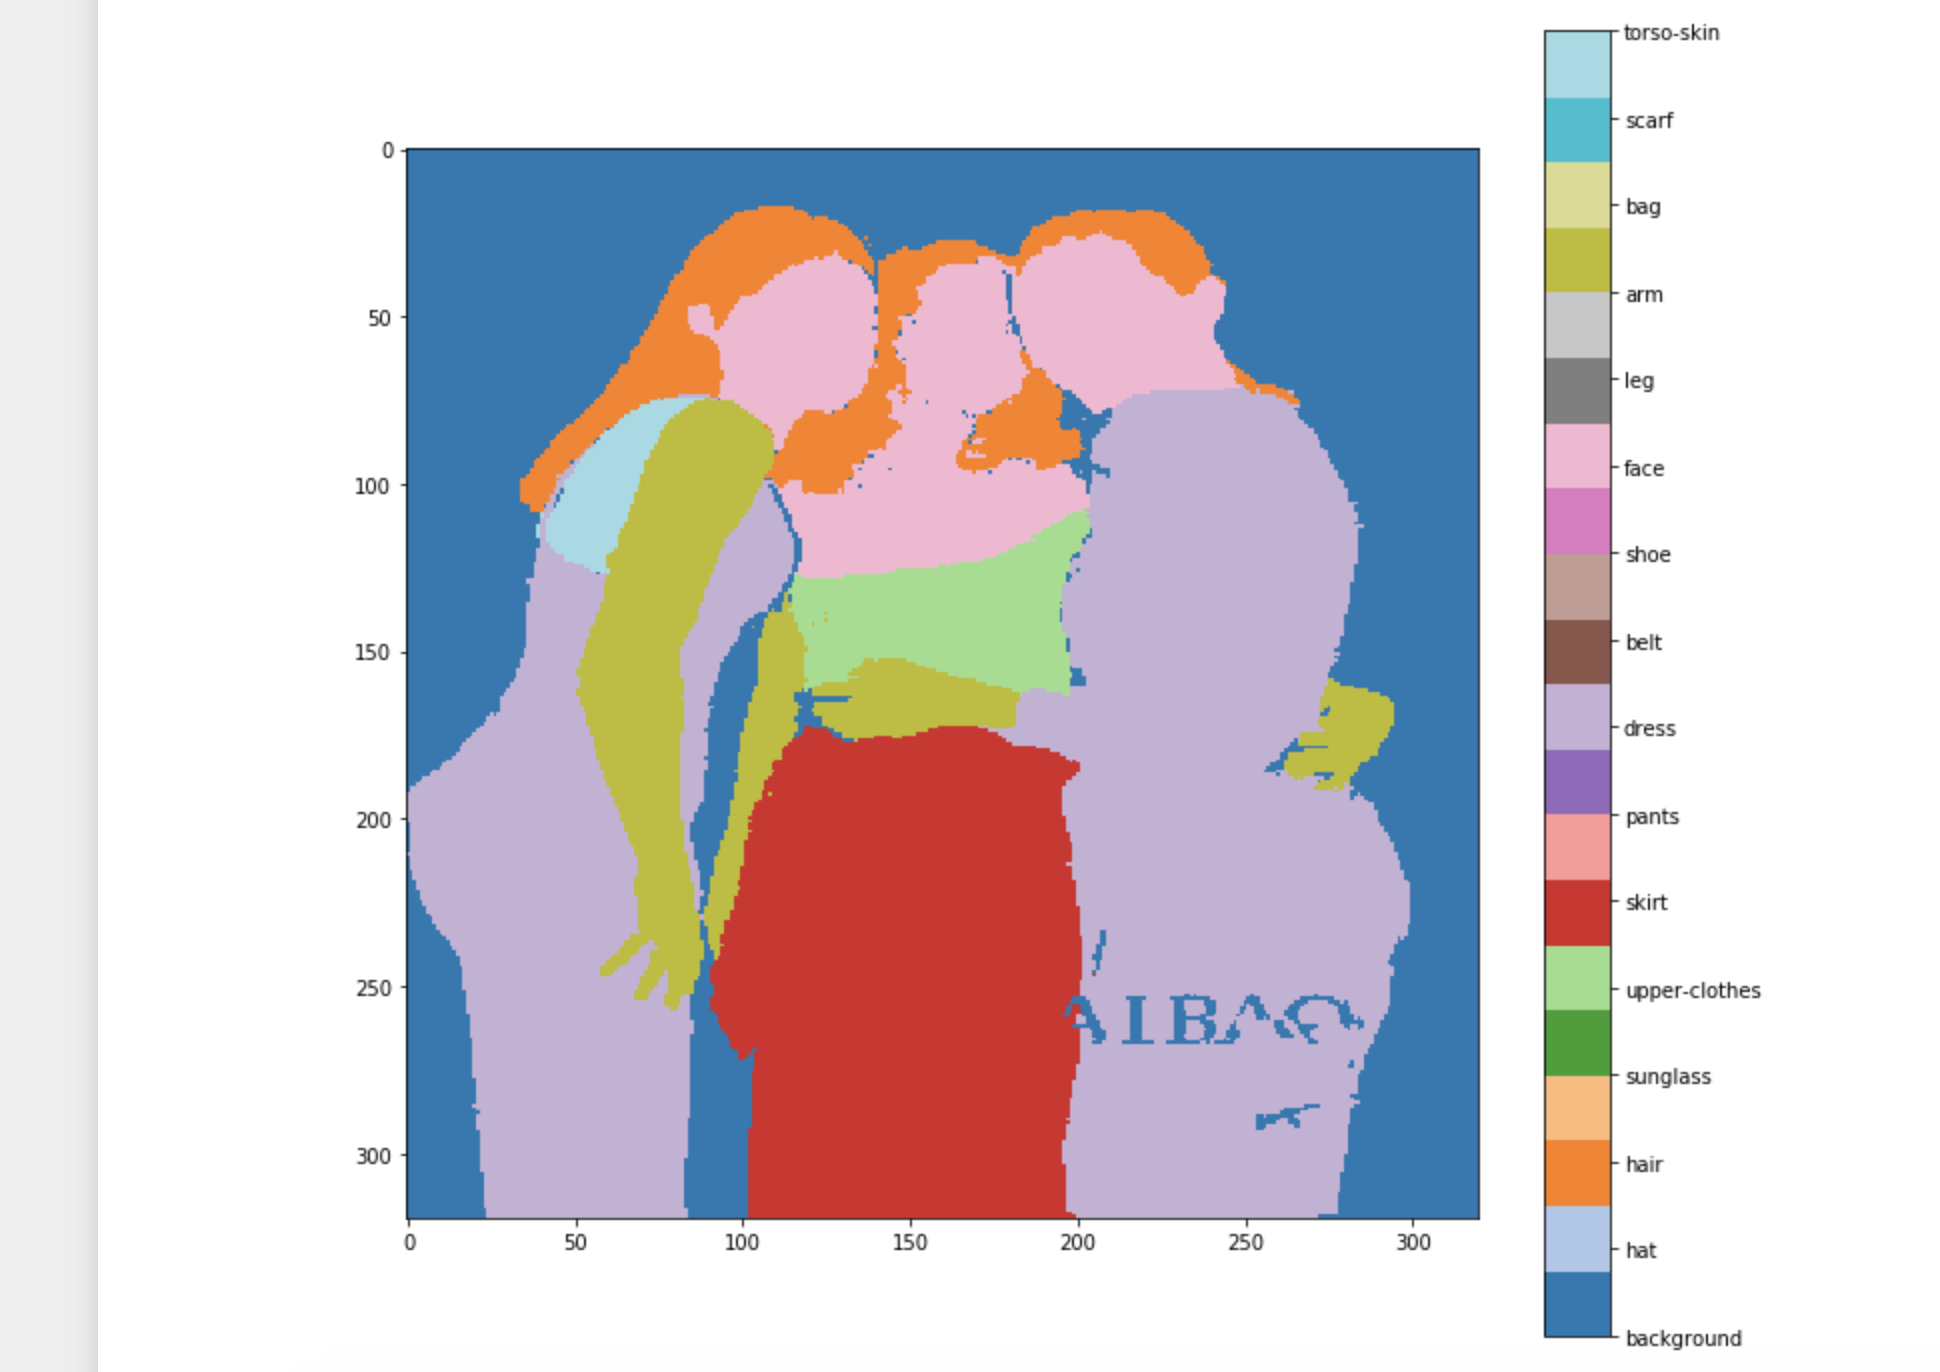
This code will generate:
or with this
def interp_show(ims:ImageSegment, classes:Collection, sz:int=20, cmap='tab20', c2i:dict=c2i):
    'show ImageSegment with given the classes'
    fig,axes=plt.subplots(1,2,figsize=(sz,sz))

    #image
    mask = (torch.cat([ims.data==i for i in [c2i[c] for c in classes]])
            .max(dim=0)[0][None,:]).long()
    masked_im = image2np(ims.data*mask)
    im=axes[0].imshow(masked_im, cmap=cmap)

    #labels
    labels = list(np.unique(masked_im))
    c = len(labels); n = math.ceil(np.sqrt(c))
    label_im = labels + [np.nan]*(n**2-c)
    label_im = np.array(label_im).reshape(n,n)
    axes[1].imshow(label_im, cmap=cmap)

    i2c = {i:c for c,i in c2i.items()}

    for i,l in enumerate([i2c[l] for l in labels]):
        div,mod=divmod(i,n)
        axes[1].text(mod, div, f"{l}", ha='center', color='white', fontdict={'size':sz})
    axes[1].set_yticks([]);axes[1].set_xticks([]);
Note: Tricky part is to have unique values same in both mask image and label image otherwise cmap will give different values. Also cmap squishes values to be mappable so if len(classes) > 20 then classes with close idxs, say 4 and 5, will be mapped to the same color.