Hi all,
I’ve been working on connecting fastai2 with javascript to do cool visualizations, you can check it here: fastexplorer.
Right now it have only 2 visualizations: the model input and layer activations.
I plan to add more, but before continuing, I will like to hear ideas about which kind of visualizations may be the useful to have. So if you have any idea, please share 
3 Likes
This is awesome! Would also be great to have a visualization of activation maps and feature maps of relevant layers. I had an attempt here and discussion understanding layer visualizations
2 Likes
Right now you can see the activation maps by clicking on a layer in the model tree (I need to update the demo image in the documentation), soon I will also add grad-cam in there.
Also, 2 possible ideas I’m currently thinking:
- A 3d visualization of all connection between layers.
- Some way to visualize the distribution of the weights or activations of all the layers in the model.
1 Like
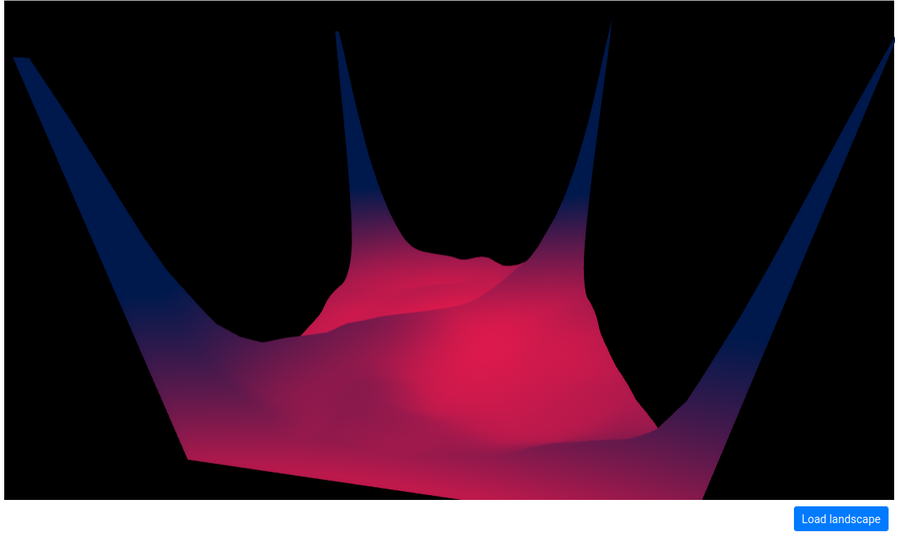
Did a first implementation of visualizing the loss landscape from this paper, but with the difference that I am calculating it for one batch instead of the whole dataset (it was taking to long to run otherwise).