Used to be available via learn.sched.plot()
I’m sure its there, somewhere, just not sure where that is.
Used to be available via learn.sched.plot()
I’m sure its there, somewhere, just not sure where that is.
learn.recorder.plot()
Thanks1
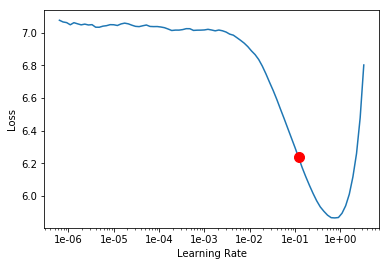
The documentation says “Here 5e-2 looks like a good value, a tenth of the minimum of the curve”.
Can you please elaborate on it? And is there anything that automatically finds the optimal point on the curve?
You can use learn.recorder.plot(suggestion=True)