ClassificationInterpretation doesn’t seem to work for multilabeled datasets (in particular plot_top_losses()).
Note also that the reference notebook for multilabeled image classification (planet) does not make use of ClassificationInterpretation.
Should we use the interpretation api differently as we deal with a multilabeled dataset?
I tried to make a PR (but couldn’t find how to do so) because I was wondering if it was possible to change the argument’s name figsz to figsize as in the original plot_top_losses() function.
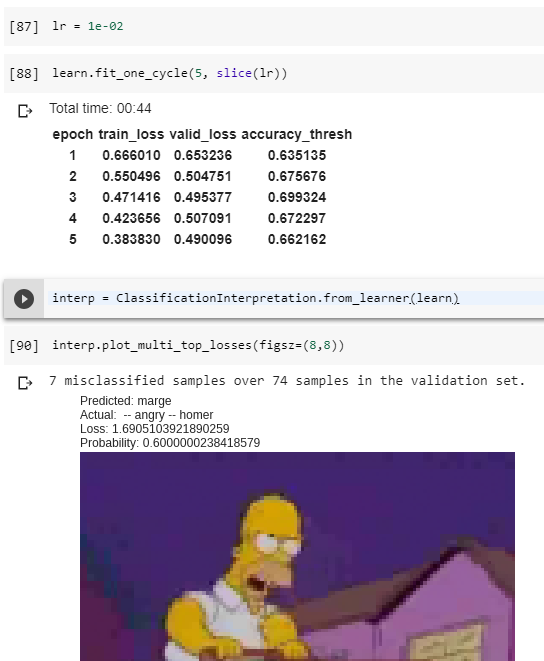
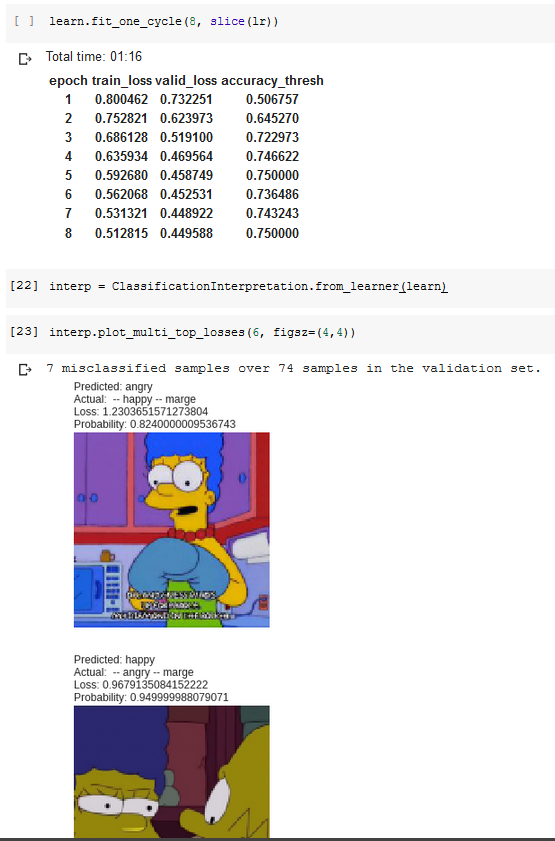
When I plot_multi_top_losses() and view the images, it displays only one label (category), as illustrated in the screenshot below.
At first, I thought it was because I used a high threshold (0.5). I lowered it to 0.1, and the plot function still only displayed 1 label.
Since you worked on such a function and problems before, I was hoping you could help me.
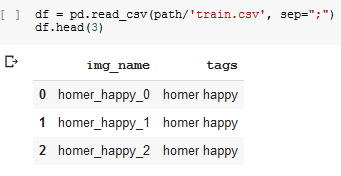
More info about my dataset and steps I did:
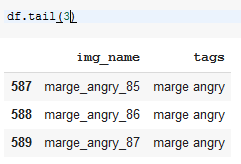
Each images in my train set has 2 labels:
the name of a simpson character (homer / marge)
and its expression (happy / angry).
I created the databunch object, set the accuracy thresh to 0.1 and trained a resnet50 model, no errors popped up.
Here is the result:
I got a 70% accuracy, which would be too high if it predicted only 1 label for every picture in the validation set. What do you think ?
Ok. You get a multi-label classification task when your data points can have more than one label (each), and this does actually happen to be the case at least once.
Now, you got a domain like this (if I’m not making mistakes): each scene is a data point, and each of your data points can in fact have more than one label: Indeed, it can simultaneously belong to up to two classes taken from a set of 4, that is, the cartesian product [homer,marge] X [happy, angry] (once you throw the ordering away).
If the above setting describes your domain correctly, you did good in using plot_multi_top_losses().
Why doesn’t it display the predicted class correctly? It should display an element from the cartesian product above, and indeed it does so for the actual class. The reason lies here:
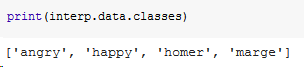
classes_ids=[k for k in enumerate(self.data.classes)]
Since it acquires the names of the predicted classes this way, it seems that the learner just predicts over two classes: homer and marge. It should predict over four classes: homer - happy homer - angry marge - happy marge - angry
It would be instructive to look at your data as a whole. Can you provide additional details about the dataset and, more importantly, its labeling?
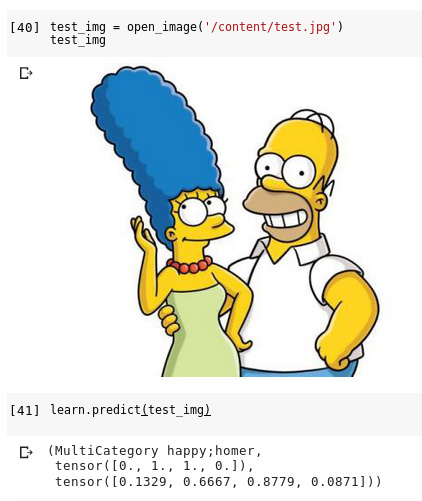
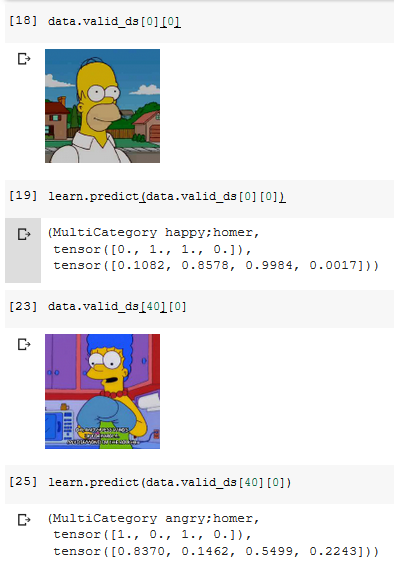
Here is the result of the predictions for 2 images:
It looks like it indeed tried to guess the character and the expression in each image which is pretty cool.
No problem.
It seems we have our answer. Note that it is not like I thought in the beginning, that is:
Rather, we have four distinct classes homer, marge, angry, happy. Now it seems the images are labeled with exactly two labels each (neither less nor more than two). Given this fact, the learner learns to predict always two labels over four, and indeed you get (see the examples you provided above) just two entries of the tensor which are above the prediction threshold. plot_multi_top_losses(), in this case, just picks up the largest one. One modification i’ll certainly do will be to pick both the relevant entries, but note that in your case it would be better to reprocess the csv in order to generate labels like the ones I was speculating above: in such manner you’ll be able to feed the model with scenes contaning both homer and marge, getting a prediction like “homer-angry, marge-happy”.
From here, I may rework the dataset a little so that the goal will be recognizing several characters in 1 image to have a better understanding of how/what the model learns (thanks to you, my understanding has already improved ). Then, l will add the expression (emotions) element.
Yes. Look at the tensor containing the probabilities: is has the outputs of four sigmoids (vs. the output of a softmax you get when you work with single-labeled data). Two of those four entries are near zero. The other two are much greater than zero. Every entry which stands above the threshold you established is a positive prediction.
I engineered the method plot_multi_top_losses() to pick the dominant prediction, the one closest to 1, since doing otherwise would have been a bit tricky and prone to potential errors.
One modification I should do would be to look at the threshold established by the user and label as positive prediction every class for which the probability is above that threshold (mimicking the behaviour of learn.predict(), but please appreciate that you can do different training cycles with different thresholds, and this is the part which makes the task a bit tricky.
Great. In that setting, you will be able to predict over a scene which has both personas in it, an ability your current model doesn’t possess.
Thank you for having inspired several ideas about how to improve the method. I’ll work upon them!
Yes that’s something I should have added from the beginning. Now with fastai v2 on its path for final release, I think it would be wiser to invest our time developing addons for it!
Sure. I’m currently working on a multilabel problem using fastai V2, I’d be glad to help implement the heatmap for multilabel problems in V2. currently my problem in the backward part of gradcam. I’m not sure how I should use the predictions in the backward pass. I’d appreciate your guidance.


 ,
,


 )
)