Hello,
I am learning deep learning using fast.ai and i have a computer with NVIDIA GPU (GTX 1050 4Gb VRAM).
1)This configuration of my GPU is it good enough ?
2) Do you have any useful tutorial for the GPU configuration on windows 10?
Thanks.
- Should do it for the start
- Install GPU drivers, Cuda, Cudnn, Anaconda, follow the fastai guide and start

Hello, this is everything I’ve done so far:
I installed pytorch and fastai through pip but then couldn’t figure out how to use my gpu.
I later realised I’ve to install cuda toolkit and cudann too, which I then did. (by install cudann I mean I moved the three files from the extracted package into the cuda folder.
I then tried but I was getting pipe broken error in lesson one. I fixed this by using num_workers=1;
now my model was training however, it was using the cpu (gpu usage was about 0% and cpu usage was constantly above 20%)
so then I followed every single step of this guide (without uninstalling anything I’ve installed before) and used conda. now the problem is while I can still train my model, it is still using my cpu. gpu usage remains at 0-2%(that too the integrated intel gpu not my nvidia gpu) while cpu usage suddenly comes close to 90-100% when model training finishes. I’m getting a time of about 3-4 mins per iteration in lesson 1’s cnn training (total time being 15ish minutes).
Please help me, thanks!
I used the same guide and it worked perfectly. Unless I installed anything in between or from another source. I guess you should try uninstalling, then follow the guide. Good luck
could you tell me what GPU you have and what kind of times you’re getting for each iteration of the first training phase? also what kernel did you choose when running it? Its 12:30 am for me but I’ll try uninstalling the things I installed through pip and do everything on conda tomorrow. I will list step by step what I did(will do) tomorrow, maybe you can see wher I went wrong.
I have a Nvidia GTX 1060 wit 6 GB. I use my own dataset, so it is hard to compare but an epoch takes around 2…3 minutes.
The Windows task manager does not show GPU performance, so ask Google for something like a Nvidia performance tool or the like. You can then see if your GPU is under load.
I can check with MSI afterburner (but task manager does show gpu usage too, it is to the far right by default). I will try reinstalling everything from scratch again and will edit this comment in about half an hour or so. Thanks!
Edit: okay I uninstalled EVERYTHING and reinstalled by following the guide’s steps exactly. when I put in “jupyter notebook” on the anaconda command line it gives me a popup box saying “python entry point not found” but when I click on ‘okay’ it opens up jupyter notebook as expected.
I ran the fit_one_cycle() function and each epoch takes about 3 minutes, I’ve noticed the following:
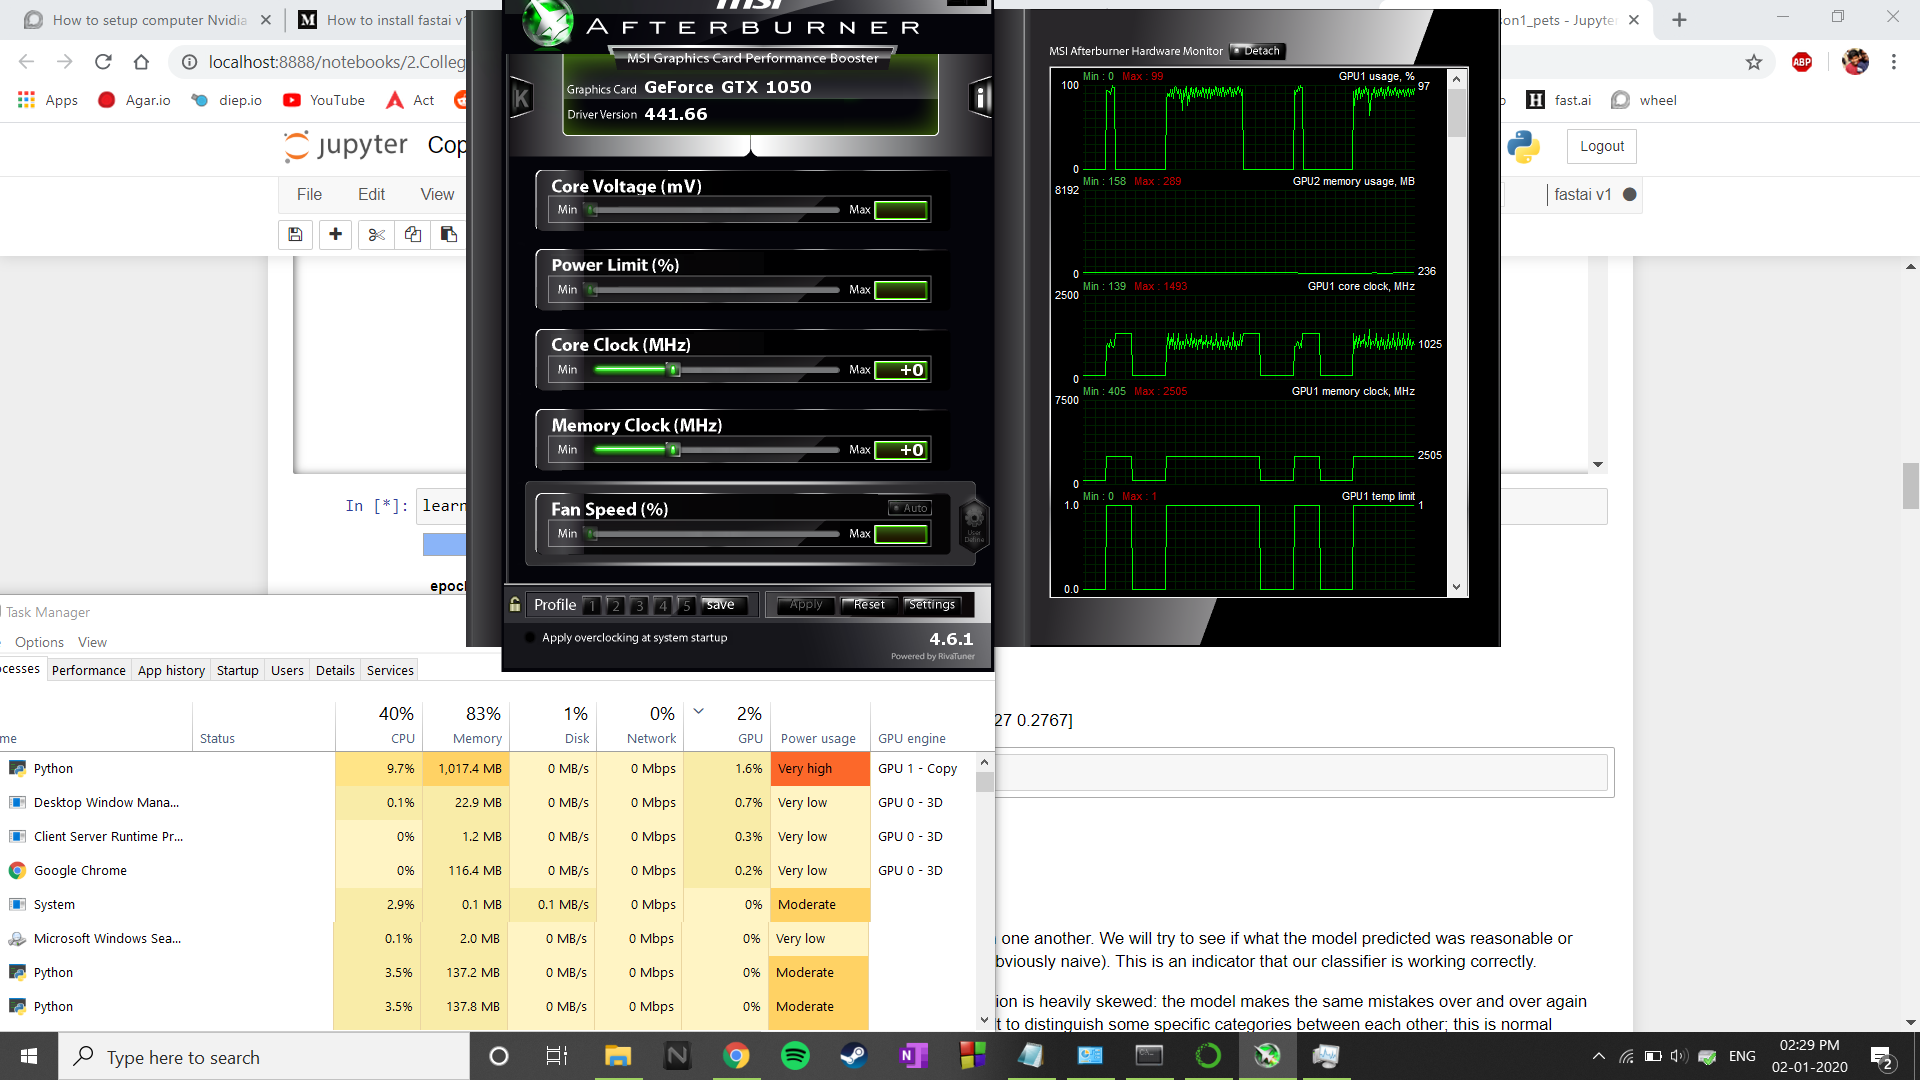
the bar below stays at 0% for about two minutes and in the last minute, cpu usage goes up very high(sometimes from 10% to 100%) and then comes back to about 40-50% for 20-30 seconds, during this same time, gpu usage accoring to my task manager is about 2% from my nvidia gpu, however msi afterburner says gpu usage is about 95% during this time. During these 20-ish seconds, the bar very quickly fills up and the epoch bar in increased by 25%. Is this the same that happens with everyone else? or is there something wrong with my setup? can you check by running the pets part of lesson 1?
I have attahed a screenshot of what is happening:
yes, same with me
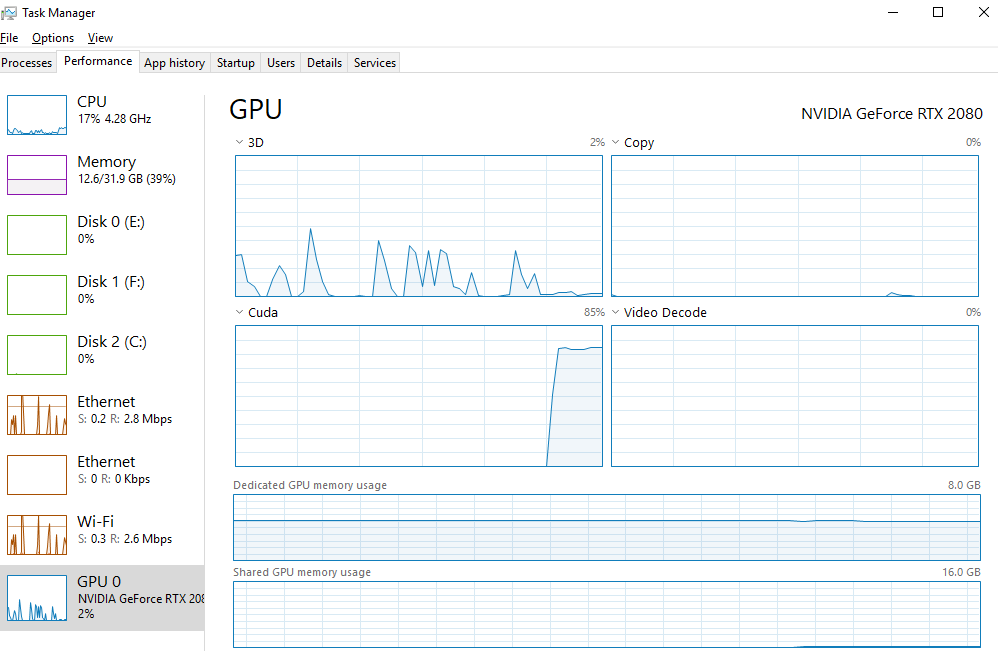
Try selecting Cuda from the dropdown list to see the fastai GPU usage. Shown as the second window down under the GPU heading in the pic below.
I don’t have a ‘cuda’ graph, I have a ‘video encode’ graph instead
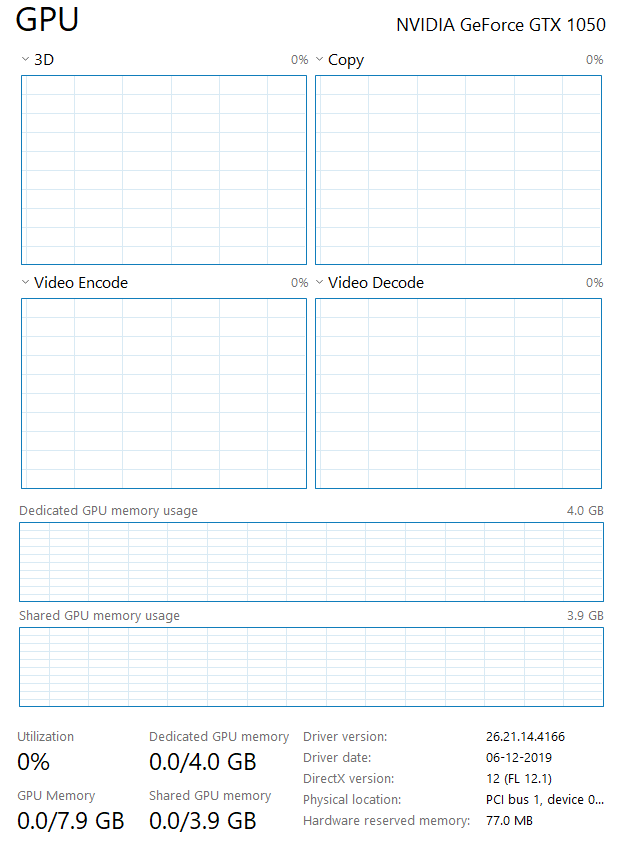
I watched the graphs and for the first minute everything stays at low levels (gpu1 at 0%) then cpu goes up to 70-80% while the graph slowly fills up. My nvidia gpu usage remained at 0% throught the whole time. gpu! activity was never there.
Edit: Okay, there is an option to monitor cuda too, but it is still zero.
Have you checked again when you perform fit_one_cycle() and MSI afterburner show’s high GPU usage?
It does it differently now, it has zero usage throught. the initial 2 minutes of the bar not moving is gone. The bar doesn’t move for the firs minute or so, but then starts moving when cpu usage is up to 60%
I haven’t used fastaiv1 for a while so I can’t comment on the GPU usage pattern. I just wanted to point you to the correct place in the task manager to observe GPU utilization while training.
I would expect greater than 50% Cuda usage reported by the windows task manager when running fit_one_cycle(). If this is not the case then you may have a driver issue. That said if MSI afterburner is reporting high GPU usage then this is probably not a problem.
would you have any clue as to why there used to be a few minutes of no gpu/cpu usage before and then both cpu and gpu usage stayed high for a while. I’m also confused as to why that doesn’t happen now, I have not changed anything but the gpu usage never went high the last time I ran the same code.
I can only guess, my first one being that something is being JIT compiled on the first run. If you are no longer observing the delay I wouldn’t worry about it.