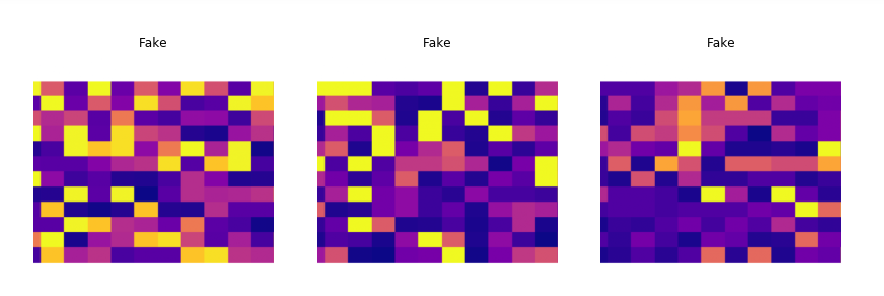
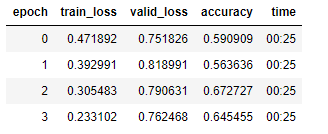
I have a dataset of heatmaps. After training it, there was a huge difference between the train and valid loss. I am assuming this is because I have turned data augmentation off as any flip, zooming, cropping doesn’t make sense as there will not be any instance of an image like that appearing. What other methods can I apply?
You haven’t indicated what you are trying do. Are you trying to train a classifier? What is your dataset? Obviously the input is a heat map, but what is the target output? Also, what is the resolution of those heatmaps? If it is extremely low, I wouldn’t recommend using cropping anyway just because of how much information you could potentially strip away.
Hey!
Yes, it is a classifier. Having two classes, fake and real. Sorry, did not get you. As it is a classifier, I guess the output is two classify both of the classes. Yes, I am not cropping them as any change in the heatmaps is a change to the underlying meaning. Additionally, I have not used any flipping etc.
Thanks
Can a human tell which are real and fake? What gives it away?
With what looks like only 11x12px images, would it make sense to try to frame the problem as tabular rather than image?
How big is your dataset, and how are you splitting train and valid?
Are you not yet using transfer learning? Even ImageNet could help.
It looks like any ‘pixel’ may be one of seven values. One method of augmentation may be to randomly change some of the ‘values’ to a nearby heat. Some sort of ‘mixup’ (half one image half another) could also help, or ‘cutout’ (remove pets of image).
Okay, so you are trying to train a classifier to spot real and fake heatmaps. Could you tell us what the heatmaps are for? Also, when you say heatmap, my mind immediately turns to infrared imagery which is most likely not what you are talking about. (This is why I made the dumb comment cropping and data loss.) You are talking about heatmaps as in the data visualization technique, correct? What architecture are you using for your model?
Data augmentation depends highly upon the nature of your data, and what real world properties it relates to. As you have not yet told us what this data is from, I can’t really give you any ideas for data augmentation.
As for over-fitting, it sounds like you need more data. What is the size of your dataset? To see that much over-fitting only in the first epoch is a little unsettling.
Hey!
Sorry for the late reply. Not sure why, but did not recieve any notification.
No, a human cannot tell the difference. Atleast, it is not obvious. Thought about running it with tabular, but what I am doing is a bit different and not conventional. Dataset is approxiamtely, 6,000 images split between the two classes. Yes, I am using ImageNet. Hmm. Will give that a try. Can you elaborate more on the ‘cutout’ part.
As this is more of a research project than a standard application, factory methods seem to be a little less accurate. Also, if you would like to talk more about it, please do DM me. Thanks!
I agree with you @RobG :
I would try a tabular model with one categorical features (1…7) per pixel. Maybe the embeddings of categorical features can help you…
Another with cnn could be using mixup as data augmentation.