1 Like
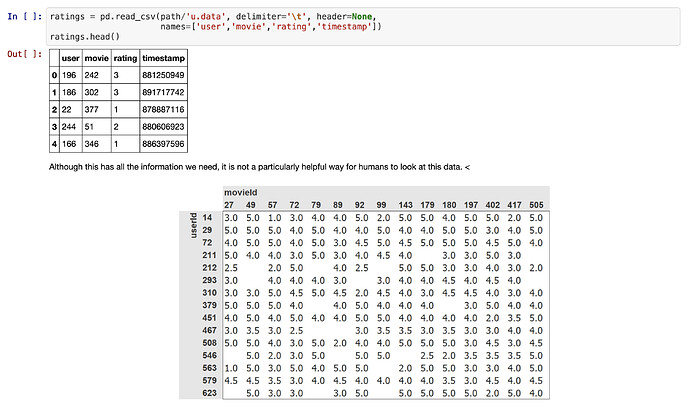
It appears like the table in fastbook was created via Excel, but we can also achieve it in pandas with,
def fill(row):
    user = row.name
    # All the rows in the ratings where the user is the user corresponding to "row"
    user_ratings = ratings[ratings['user'] == user]

    # Go through all the movies
    for movie in row.index:
        # Find the rating the current user gave to the current movie
        # It is possible there is no such rating, in which case we'd get an empty array
        rating = user_ratings[user_ratings['movie'] == movie]['rating'].values
        row.loc[movie] = rating


path = untar_data(URLs.ML_100k)
ratings = pd.read_csv(path/'u.data', delimiter='\t', header=None,
                      names=['user','movie','rating','timestamp'])

# The indices are the users,
# the columns are the movies
table = pd.DataFrame({}, index=ratings['user'].unique(),
                     columns=ratings['movie'].unique())
table.index.name = 'user'
table.columns.name = 'movie'
table.apply(fill, axis=1)
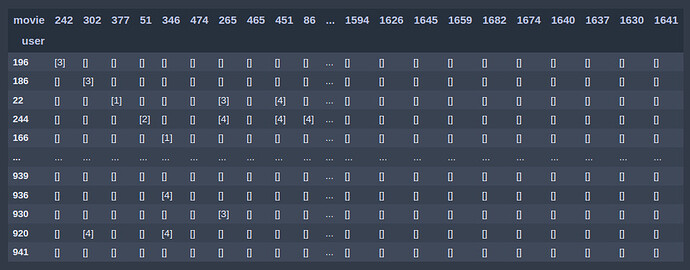
table would now be,
Please bear in mind, this is excruciatingly slow & inefficient, but it is all right for smaller DataFrames like the MovieLens 100K dataset. Possible improvements would be vectorization, creating a dictionary where the keys are the user & movie IDs and the values are the ratings to avoid looping through all the movies each time, taking advantage of sparse data structures, and more.
Hopefully this helps!
1 Like
It looks really cool! Thank you so much!
1 Like
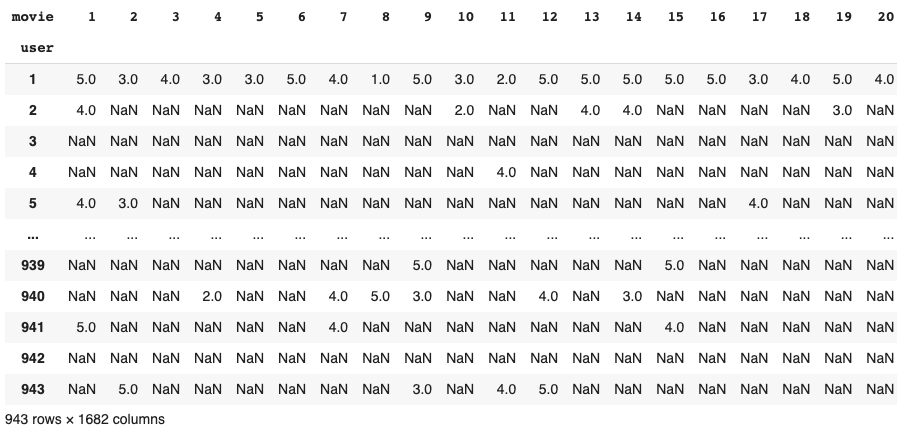
Another option would be to use the crosstab() function in pandas:
from fastai.tabular.all import *
path = untar_data(URLs.ML_100k)

ratings = pd.read_csv(path/'u.data', delimiter='\t', header=None, names=['user','movie','rating','timestamp'])

pd.crosstab(ratings.user, ratings.movie, values=ratings.rating, aggfunc='sum')
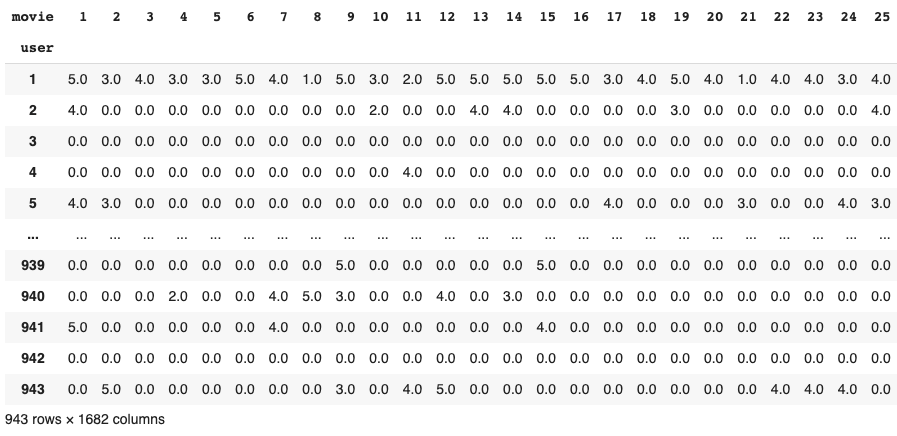
If you want to get rid of the NaNs, you can use the fillna() method:
pd.crosstab(ratings.user, ratings.movie, values=ratings.rating, aggfunc='sum').fillna(0)
2 Likes
Wow! That’s amazing! Thank you!


