From my scheduler, I see the following plot as:
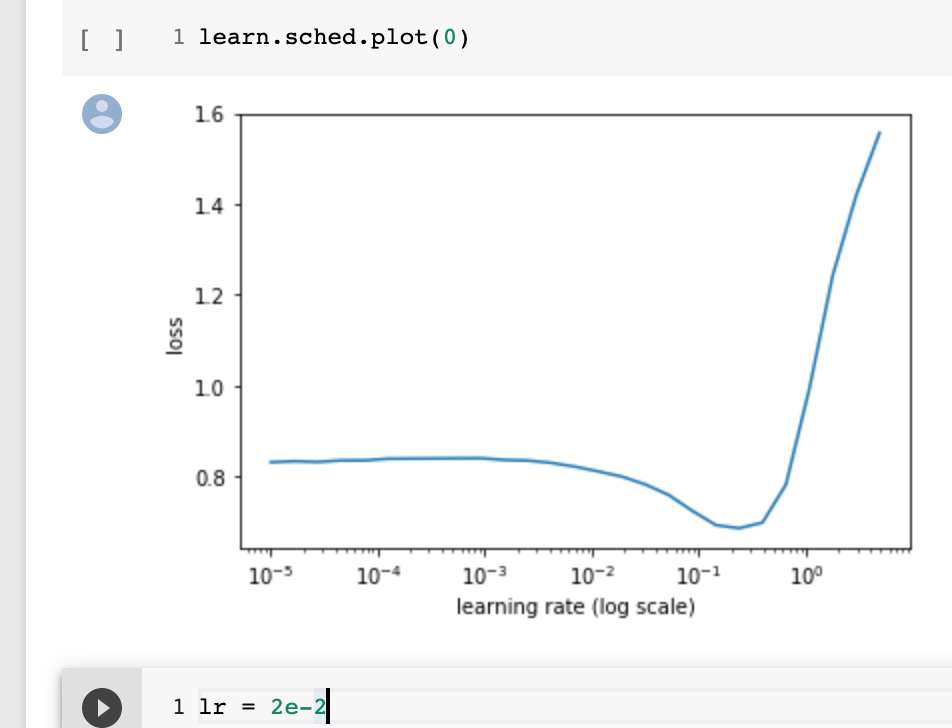
As we can see, chosen LR in this notebook was : 2e-2, but the range where loss was stable before going too high is approximately 1e-2.
Any thoughts on how to choose this?
THanks
Sandeep
From my scheduler, I see the following plot as:
As we can see, chosen LR in this notebook was : 2e-2, but the range where loss was stable before going too high is approximately 1e-2.
Any thoughts on how to choose this?
THanks
Sandeep
You’ll want to select the point where loss starts going down quickly but is not yet at the bottom. At 2e-2 loss reduction starts accelerating, making it a good LR when using the standard Fast.ai methods.