I am trying to add lesson 2’s CSV label stuff to something like lesson 1’s classifier & tfms.
I have a fastai.dataset.ImageClassifierData object that I’d like to plot.
I am generating the data using:
def get_data(sz):
    tfms = tfms_from_model(m, sz, aug_tfms=transforms_top_down, max_zoom=1.05)
    return ImageClassifierData.from_csv(PATH, 'train', label_csv, tfms=tfms,
                    suffix='.png', val_idxs=val_idxs, test_name='valid')
data = get_data(sz)
ims = np.stack([get_data(sz) for i in range(6)])
ims outputs:
array([<fastai.dataset.ImageClassifierData object at 0x7f4432034f28>,
       <fastai.dataset.ImageClassifierData object at 0x7f4432034b38>,
       <fastai.dataset.ImageClassifierData object at 0x7f44321061d0>,
       <fastai.dataset.ImageClassifierData object at 0x7f4432019ef0>,
       <fastai.dataset.ImageClassifierData object at 0x7f4432081cf8>,
       <fastai.dataset.ImageClassifierData object at 0x7f443203f1d0>], dtype=object)
So… I know that there is data there to draw, but I’m not sure how.
Tried:
plots(ims, rows=2) … fails saying TypeError: Image data cannot be converted to float, and
imgplot = plt.imshow(ims[0]) … but that fails saying TypeError: Image data cannot be converted to float and outputs a blank graph.
How does one plot a “fastai.dataset.ImageClassifierData” object?
I don’t think you can plot it though you can plot the images that it serves.
It can get a bit tricky with transforms. Best would be to see how the images are plotted in one of the notebooks and reproduce. Both lesson 8 and 9 notebooks have a lot of functionality devoted to plotting.
I think this from lesson 8 should be a good start. Once you get a hold of the image like here you can do various things with it.
In your code, you are generating 6 data objects. Each data object holds the entire data, at least the trn and val datasets and sometimes even the test set.
data = get_data(sz)
ims = np.stack([get_data(sz) for i in range(6)])
You should be able to run the code from the lecture if you do this before in your code:
md = get_data(sz)
BTW the acronym md stands for model data so it is a bit easier to think about it.
Your ims is a list of ImageClassifierData objects, you are essentially replicating the whole of your data set 6 times. You should only create one instance like so, as per @radek suggestion:
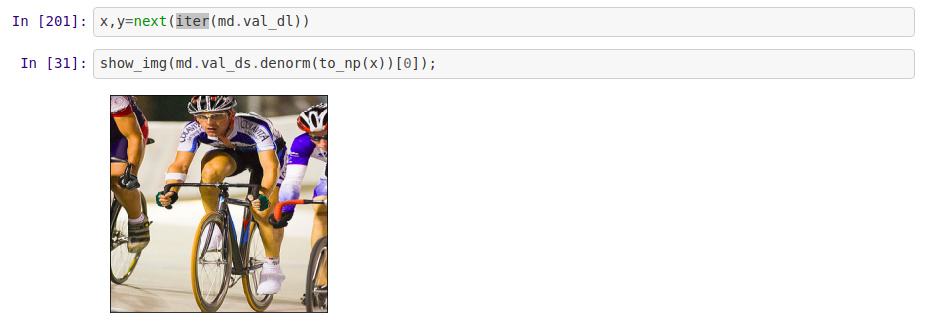
md = get_data(sz)
Then you can access individual train images by accessing the following property, which has both images and labels:
data = get_data(sz)
x,y = next(iter(data.val_dl))
datadenorm = data.val_ds.denorm(to_np(x))[1]
ims = np.stack([datadenorm for i in range(6)])
plots(ims, rows=2)
But the images are all the same… aren’t they supposed to be flipped and such?
You are accessing the validation data loader where images are not augmented. Augmentations are applied when accessing train images using trn_dl.
data.val_ds.denorm() performs an operation opposite to normalization. When using pretrained models, or training from scratch, we might want to normalize our inputs to zero mean and normalize their range. This can help with training and was especially helpful in the past before the invention of batch norm, adaptive learning rates, weight initialization, etc.
How can apply that object detection model [lesson (9)] on new image data set?
I tried
fp = str(PATH) + “/” + “person.jpg” ; fp
trn_tfms, val_tfms = tfms_from_model(f_model, sz, aug_tfms=transforms_side_on, max_zoom=1.05) # get transformations
im = val_tfms(open_image(fp))
learn.precompute=False
preds = learn.predict_array(im[None])
but I got array! and the shape of array are : print(im[None].shape) , print(im.shape)
(1, 3, 224, 224)
(3, 224, 224)
Is there any suggestion?
To plot the two arrays that you got you need to rearrange the channels.
For the first array (1, 3, 224, 224), you need to drop the 0th dimension and rearrange the others so that the shape of the array will be (224,224,3). Then you can plot that as an image.