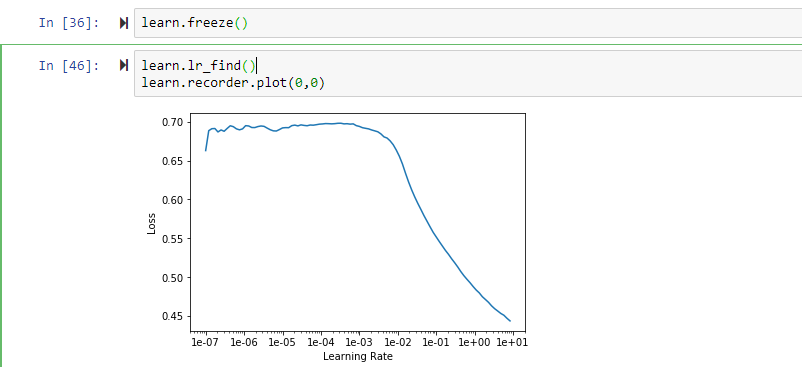
It seems you can use a very high learning rate. Usually it’s advised to choose a region with a steep slope in the graph. But in doubt it’s always good to try a few options like 0.03, 0.1, 0.3, 1 and plot the losses.
2 Likes
Thanks! I will try them out.
Out of curiosity - what type of data or problem is this for? Vision, NLP, tabular?
Its for vision , single object bounding box to be precise
1 Like