Hi,
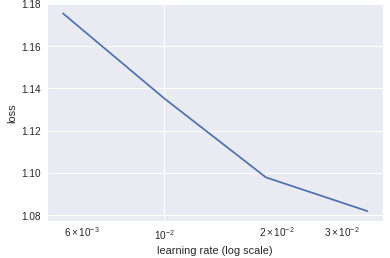
I am trying with my own images. My samples in training is about 88 images. Initially I could only produce a blank sched.plot(). Later looking at forums, I reduced batch size to 4 (trial and error) and I see the below. I am unsure how to interpret this as the graph is very abrupt. I was expecting a smooth curve instead this looks like a set of straight lines. Can someone help me with interpeting this as well as explain why I am not getting a smooth curve?