Hi everyone,
I’m in the process of creating a fully self-contained Colab notebook to demonstrate an end-to-end workflow for building segmentation from overhead imagery. This means covering not only the DL model training and inference part but also all of the less-covered steps and interstitial stuff to go from data creation to model creation to inference on new imagery to evaluation against ground truth.
This is very much a work-in-progress and still incomplete but I’m happy to share with you this earliest version for your feedback. v1 of blog & notebook is published on 7/25! It is set up to be fully executable in Google Colab either from beginning to end or within each workflow section/step independently. Package dependency installations are all working as of 7/25 and I tried to include download links to the generated artifacts at each step so you can pick up and start from any point:
Updated 7/25, published Medium post:
Updated 7/25, published Colab notebook v1 link:
Any feedback about the post or notebook is much appreciated! DMing me here or commenting on Medium/github both work. Much thanks!
Some highlights:
-
Added 7/22: Wrote much more commentary explaining each major step with references to learn more.
-
Added 7/22: demo’ing SpatioTemporal Asset Catalogs and browser for visualizing geospatial datasets for ML:
-
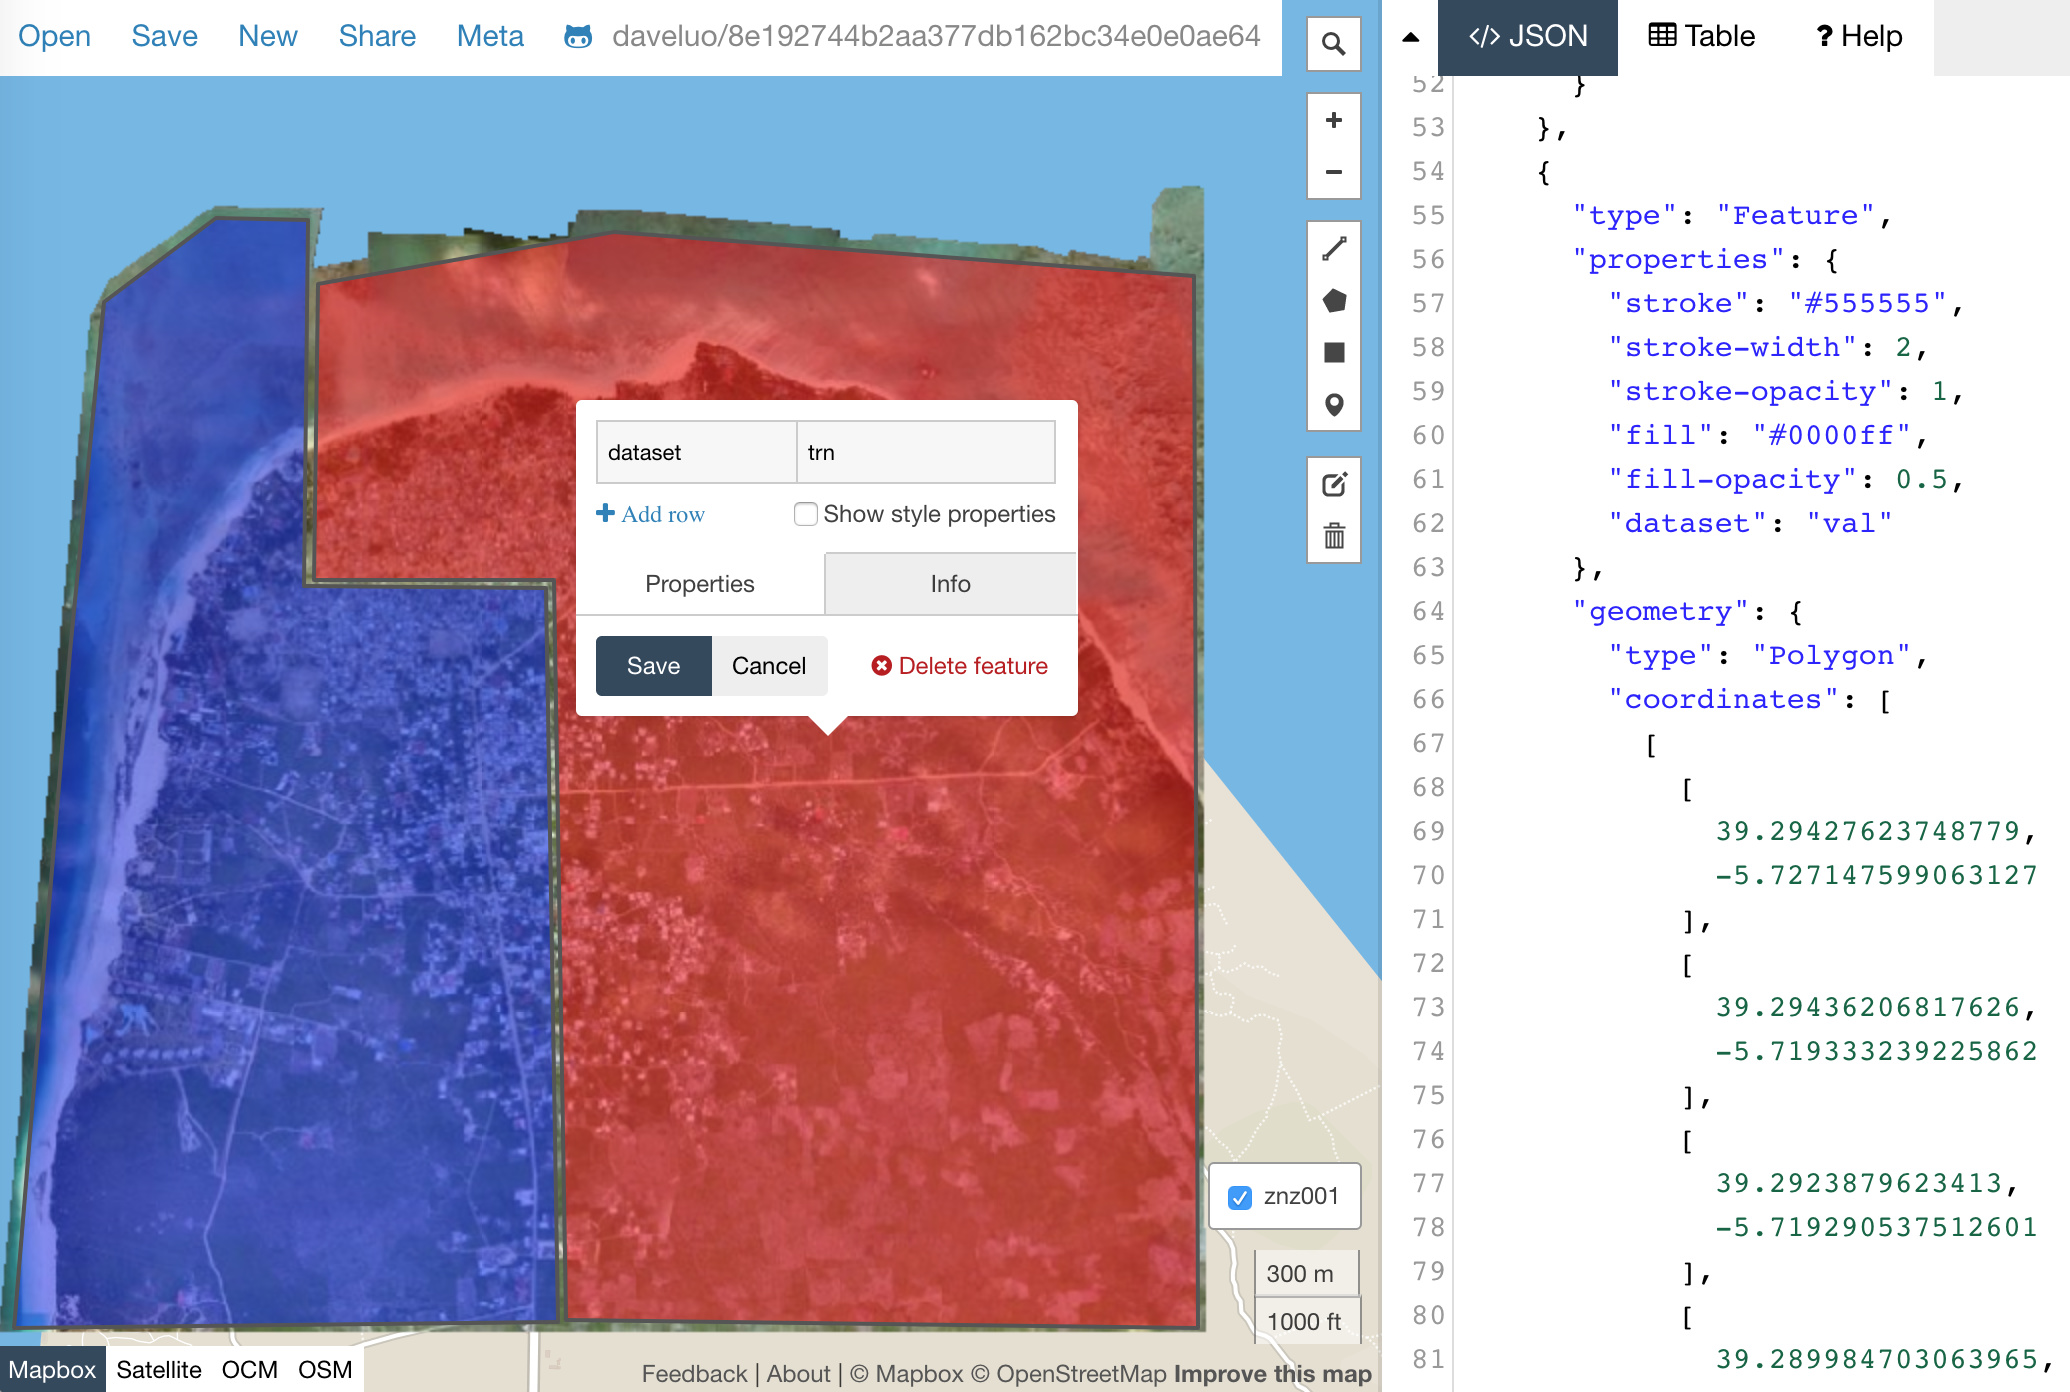
Updated 7/18: creating complex-shaped training and validation AOIs with geojson.io:
-
Updated 7/22: checking & removing overlapping tiles between train and validation:
-
Added 7/18: cleaning up invalid and overlapping geometries
-
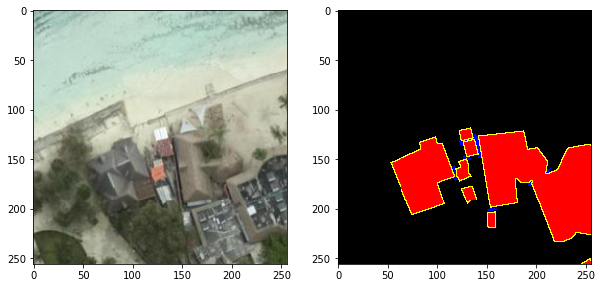
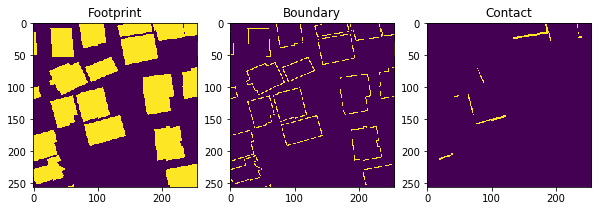
tiling geoTIFFs and geojson files to create image and mask pairs in 3 channels with supermercado, rio-tiler, geopandas and solaris:
-
customizing fastai’s default segmentation approach to handle 3-channel target masks:
-
Updated 7/18: custom loss functions and metrics combining BCE, Focal Loss, Dice Loss or any other loss function with adjustable weighting by loss function and by channel:


class MultiChComboLoss(nn.Module):
    def __init__(self, reduction='mean', loss_funcs=[FocalLoss(),DiceLoss()], loss_wts = [1,1], ch_wts=[1,1,1]):
        super().__init__()
        self.reduction = reduction
        self.ch_wts = ch_wts
        self.loss_wts = loss_wts
        self.loss_funcs = loss_funcs

    def forward(self, output, target):
#         pdb.set_trace()
        for loss_func in self.loss_funcs: loss_func.reduction = self.reduction # need to change reduction on fwd pass for loss calc in learn.get_preds(with_loss=True)
        loss = 0
        channels = output.shape[1]
        assert len(self.ch_wts) == channels
        assert len(self.loss_wts) == len(self.loss_funcs)
        for ch_wt,c in zip(self.ch_wts,range(channels)):
            ch_loss=0
            for loss_wt, loss_func in zip(self.loss_wts,self.loss_funcs):
                ch_loss+=loss_wt*loss_func(output[:,c,None], target[:,c,None])
            loss+=ch_wt*(ch_loss)
        return loss/sum(self.ch_wts)
-
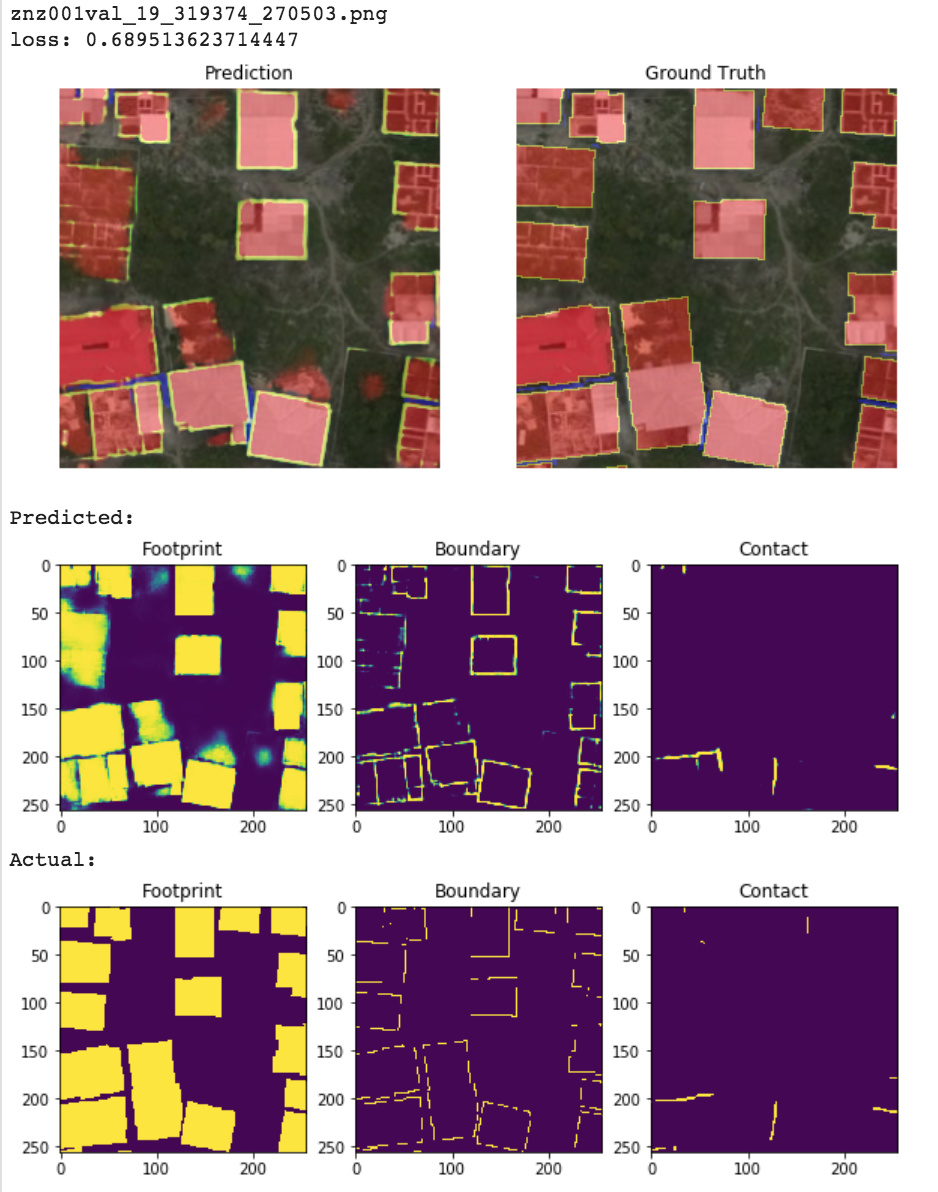
Examining segmentation results sorted by image-wise loss:
-
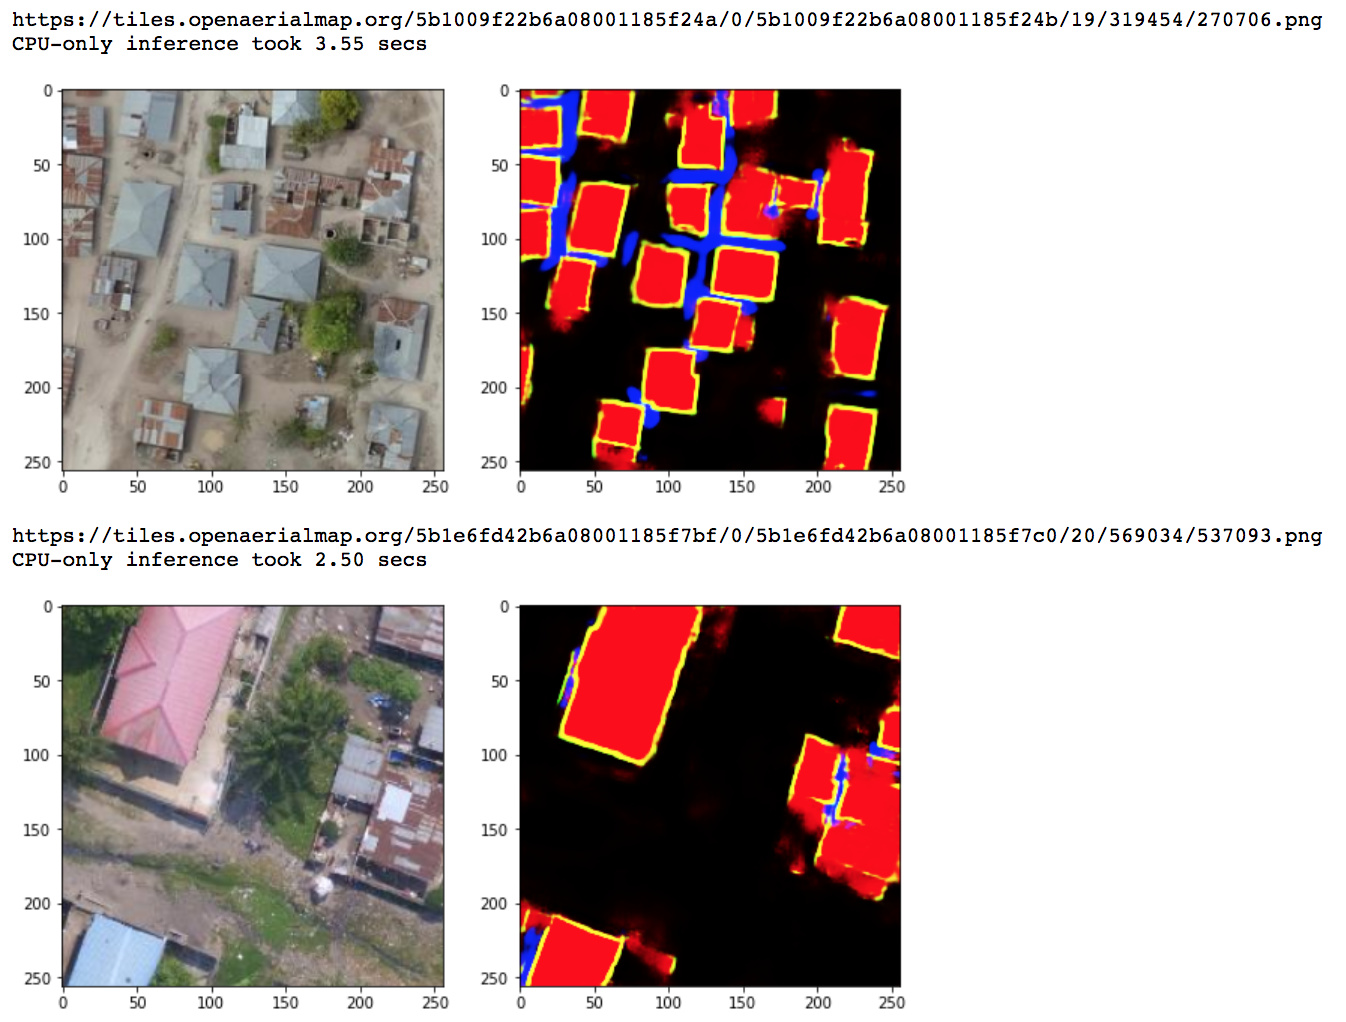
Updated 7/18: Exporting model and reloading for inference on new unseen imagery with time tests on CPU vs GPU:
-
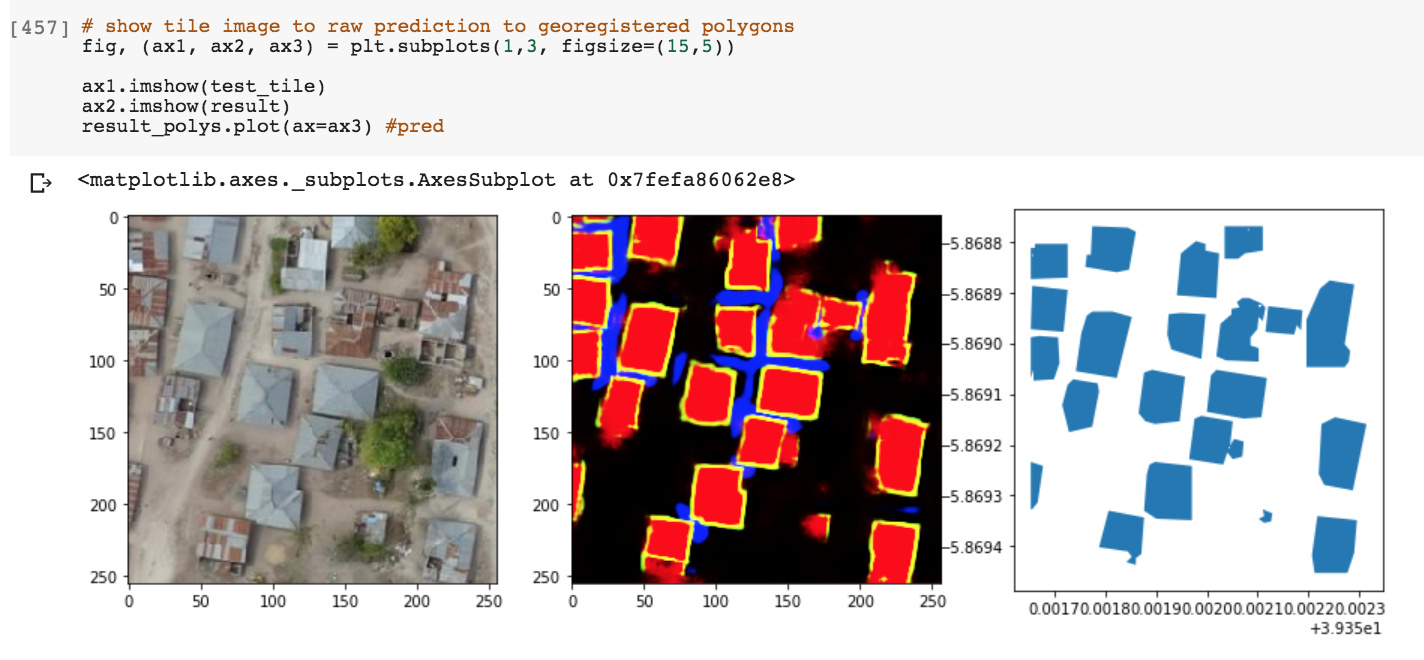
Added 7/19: Threshold, polygonize, and georegister a segmentation prediction result with solaris:
-
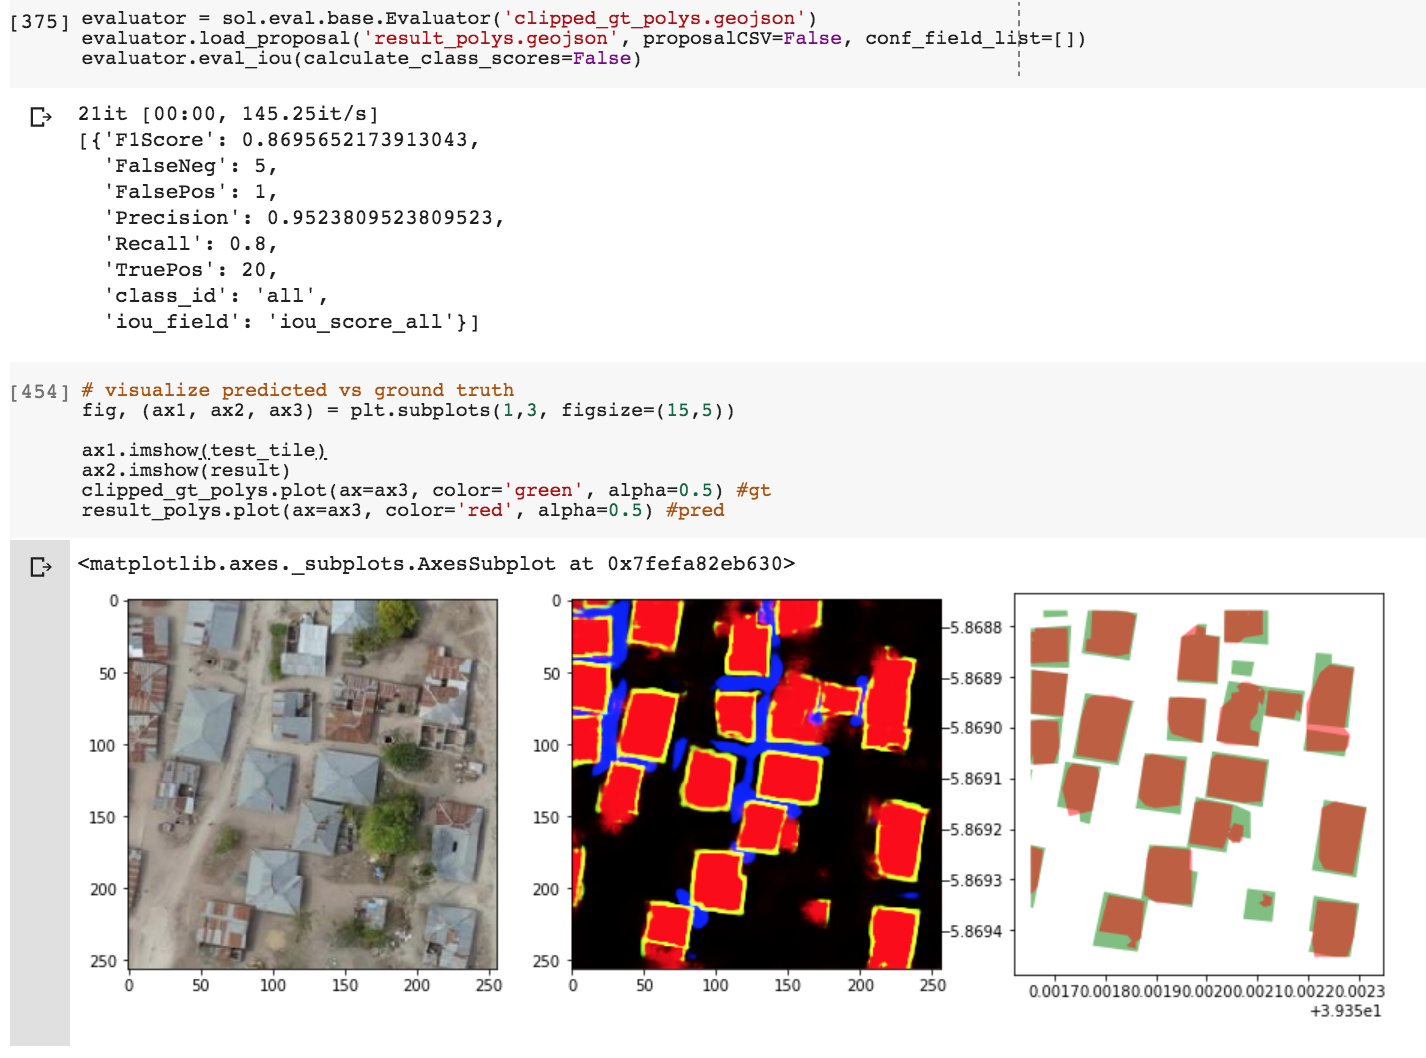
Added 7/19: Evaluate a predicted tile against ground truth (TP, FP, FN, precision, recall, F1 calculations) with solaris:
Much thanks to the creators and contributors of these newest and greatest geospatial tools which I’ve used extensively here:
- Geopandas: http://geopandas.org/
- Rasterio: https://github.com/mapbox/rasterio
- Solaris: https://github.com/CosmiQ/solaris
- Rio-tiler: https://github.com/cogeotiff/rio-tiler
- Supermercado/Mercantile: https://github.com/mapbox/supermercado
- Cloud-optimized geotiffs (COG): https://www.cogeo.org/
- Spatio-Temporal Asset Catalogs (STAC): https://stacspec.org/
- OpenAerialMap: https://openaerialmap.org/
- Fast.ai!
I look forward to hearing your feedback on what parts are not working, could be made clearer and cleaner, or steps I missed or should explain in more detail. The notebook currently sits as a secret gist but the plan is to polish and publish the Colab notebook(s) into a public and open-sourced repo after incorporating your initial feedback. I’ll also write an accompanying blogpost to help guide folks through it. Done!
Also to note: the focus of this notebook is to demonstrate a workflow so I did not extensively train the model or do much to optimize the segmentation results itself. There is much performance to be gained!
Dave