Came across this article, it claims it provide a accurate and consistent feature importance over permutation method. Seems like an interesting tools for interpreting model.
(edited: Here is my ongoing attempt with the library)
I am going to read the paper and give it a try on the same notebook of the ML course to get a comparison over this weekend. Hopefully I will have something to share.
(you may want to download the html, something graph seems not rending properly with JS on github)
I have a quick question.
I use rfpimp to calculate permutation importance, the sum of the importance is 1.31 instead of 1(not sure about the unit of the “importance” is, maybe is R2 value?), maybe you have more experience with this library?
Please advise what more I should be experimenting.
It’s not completely done yet, planning to test how does SHAP react to redundant features/highly correlated features and LightGBM.
Thanks for looking at that! @parrt you might be interested. Here’s a link to the nbviewer rendered version of the notebook:
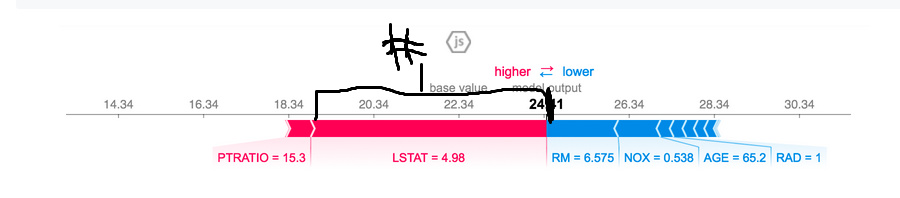
@nok, I suggest you remove year==1000 from the PDP/ICE plots, otherwise they are hard to interpret. For the tree interpreter, it’s best visualized with this: https://github.com/chrispaulca/waterfall
These 2 changes should give you a better comparison.
Thank you! Good to learn about nbviewer and thanks for the waterfall chart suggestion, I agree that although the SHAP library comes with fancy js plot, it’s clearer to read information from the waterfall chart.
I struggled on how to add existing plot to a subplot, I could not find a way to make 2 waterfall chart in the same subplot. If I already have the fig and ax of a plot, can I simply add this into another plt.subplots()?
Computing permutation importance is a matter of measuring the drop in accuracy when you commute one of the feature columns. Because of this, there’s no reason why the sum of these numbers would be meaningful. Naturally we could normalize this to be between zero and one but it’s really the relative value that matters not the actual value.
SHAP importance is something I haven’t investigated other than to look at the paper and think wow that is pretty complicated mechanism Apparently it works well and is likely faster than my highly non-optimized/non-parallel implementation of perm imp.
Not really, in fact the SHAP paper seems put a lot of effort to optimize, as the brute force way to compute is O(2^n). In my trial, I use 1000 sample points, with your permutation importance it takes 8 seconds, while it takes almost 4 minutes for SHAP value computation.
I think it is really complicated, that’s why I rather experiment with it as I figure out I will never understand anything by reading the math myself…
The reason I want to normalize it to 1 is to compare these importance in a kind of same scale. Maybe the relative importance (order) is more important, they seems suggesting different thing in my trial.
I think adding up for individual row make sense, less need for feature importance.
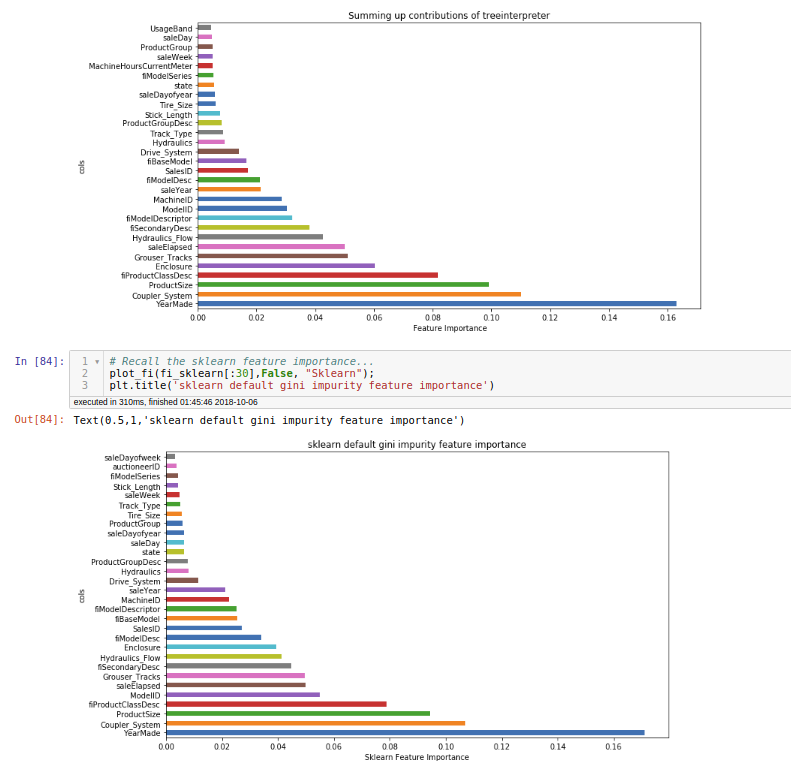
The way that SHAP feature importance works is adding up individual rows contributions, this make me thinking that does it make sense if we add up row contributions from tree interpreter to get a feature importance.
Thanks for the reference! I tried to verify this by adding up the absolute individual contributions of tree interpreter, indeed they look very similar (but I do not know why the features with less importance are different). For my case, it is a regressor, so the feature importance is MSE reduction, not Gini impurity. I enjoy knowing these details, and connecting these pieces in my mind!
We have used SHAP at work to get an idea why certain predictions are happening. It has been great. There are times where it isn’t perfect (especially as a summary), but it is pretty solid and gives us better insight in our predictions. It has given us some explanation when somebody doesn’t understand a prediction.
Do you mean feature importance is less useful than individual row explanation from your experience? It runs pretty slow from my experience, could you share more how do you use it in your workflow?
feature importance is really useful for selling our models to business stakeholders, but they don’t trust it until you can give them individual stories. Usually they match pretty well with what you would expect, but every once in a while you will have one that looks like a total outlier until you look at the shap predictions. What we generated was built (very hackily) from the shap.force_plot code. Basically We just looked inside that to see where the values were happening and extracted it from there. It definitely wasn’t straightforward and was quite slow, but that isn’t a huge deal for what we are doing because we only run our models once per month at the moment.
Once we get all of these into text form, we have a list of how every feature changes every prediction. At that point, we go to a different tool for data manipulation (Alteryx - really good, but pricey). This is something that could definitely be done in Python as well, but for us, it is easy enough to move over and just do some ETL on it to get it exactly how we want it formatted.

 Apparently it works well and is likely faster than my highly non-optimized/non-parallel implementation of perm imp.