Hi there,
currently I am working on the OSIC Pulmonary Fibrosis Progression Data. I have loaded the Dicom Files in a datablock and I can display it.
The problem is, that the data is not normalized and I could not figure out how to normalize it. It is extremely bright or dark.
Here is my code so far:
root_dir = Path('kaggle/input/osic-pulmonary-fibrosis-progression')

items = get_dicom_files(root_dir/f"train/")

data = DataBlock(blocks=(ImageBlock(cls=PILDicom), CategoryBlock),
             get_x= lambda x: x,
             splitter=RandomSplitter(seed= 2),
             item_tfms = [Resize(size= 512, resamples= (Image.NONE,0))],
             batch_tfms = [*aug_transforms(), Normalize.from_stats(*imagenet_stats)])

dls = data.dataloaders(items)
Now, if I display it by running the following code:
dls.show_batch(max_n= 4)
I get the following images:

I would like to get something like this, where the normalization is applied:
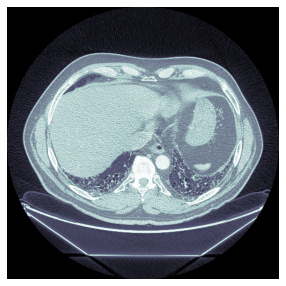
Which I get, when I run the following code:
items[0].dcmread().show()
Any idea how I can do that?
Thank you!
P.S.:
I had to use the following parameter in the Resize method:
resamples= (Image.NONE,0)
Otherwise I would get a ValueError: “Image has wrong mode”.