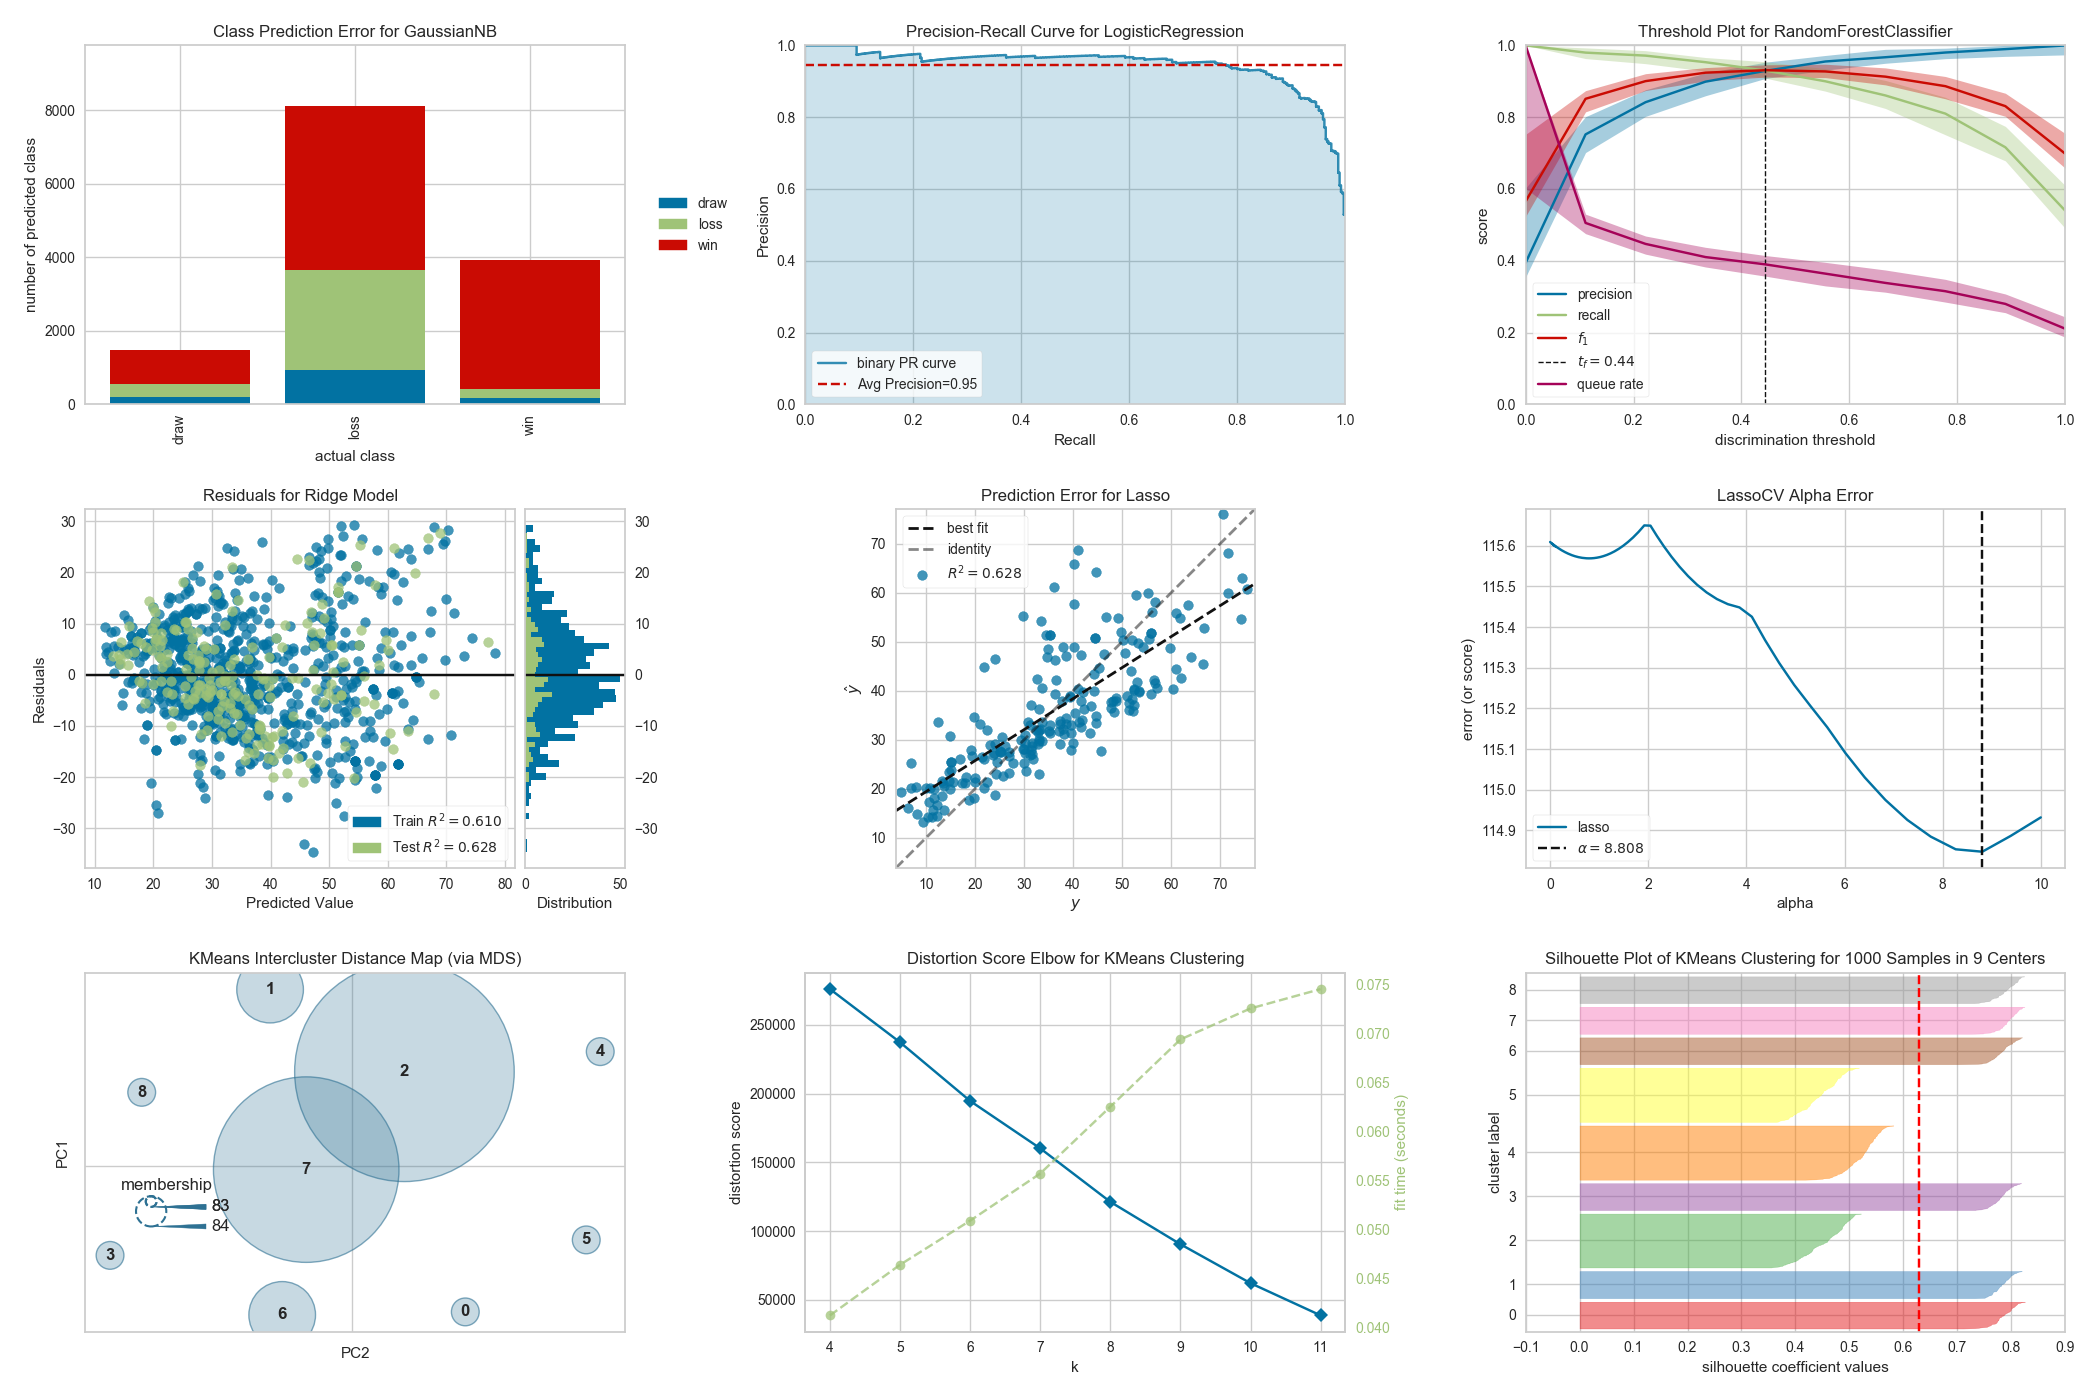
Hey, i’ve seen several topics about models performance visualisation (ROC curve, precision vs recall) and i believe many people have their own boilerplate code doing the same graphs. I really like Yellowbrick approach for sklearn models and I thought we could use it for fastai Learner. Here is a notebook with a small wrapper alining fastai learner with sklearn api allowing to reuse yellowbrick visualisations for classification. Potentially, with more generic class, this can be useful for other libraries. I think it would be cool to incorporate native versions of them in the Interpreter but adding all graphs is a non-trivial task, for now the hacky way seems to work. Any comments appreciated!
@ Micstan
Am working on binary classification problem using tabular learning. I want to plot ROC curve using the solution that you share and i got the following error:
AttributeError Traceback (most recent call last)
in
3 size=[500,500],
4 title=“ROC for Fastai Learner”)
----> 5 visualizer.score(X_test, y_test)
6 visualizer.poof();
~/anaconda3/envs/venv_p383_torch/lib/python3.8/site-packages/yellowbrick/classifier/rocauc.py in score(self, X, y)
260 y_pred = self.get_y_scores(X)
261
–> 262 if self.target_type == BINARY:
263 # For binary, per_class must be True to draw micro/macro curves
264 if (self.micro or self.macro) and not self.per_class:
~/anaconda3/envs/venv_p383_torch/lib/python3.8/site-packages/yellowbrick/utils/wrapper.py in getattr(self, attr)
40 def getattr(self, attr):
41 # proxy to the wrapped object
—> 42 return getattr(self._wrapped, attr)
AttributeError: ‘SklearnWrapper’ object has no attribute ‘target_type_’.
I solved this issue by adding a class variable. Not sure if is the best approach…
class SklearnWrapper(BaseEstimator): estimator_type = “classifier”
target_type = “BINARY”