I’m creating this thread for general discussions about using fastai and pytorch on Windows, and in order not to pollute the installation thread created by @jeremy, which, I think, should be reserved to troubleshooting windows installations.
My questions:
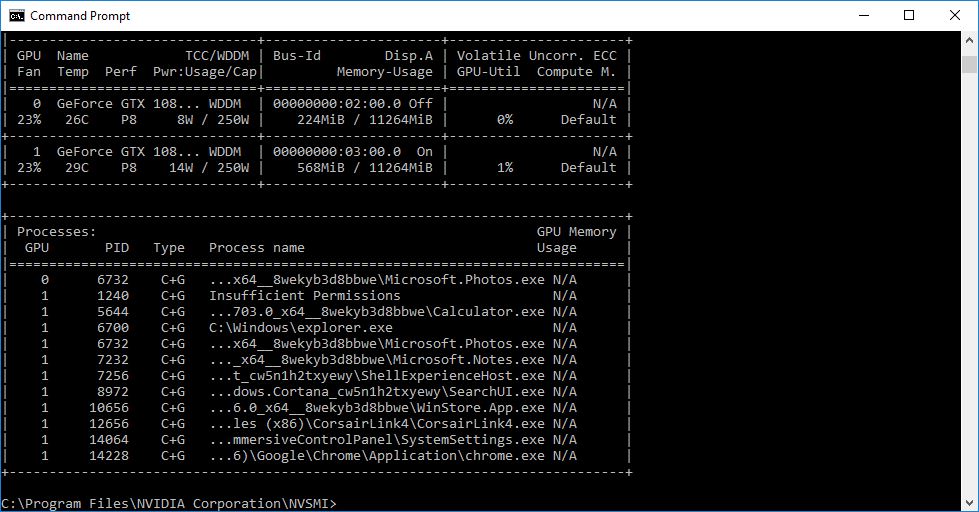
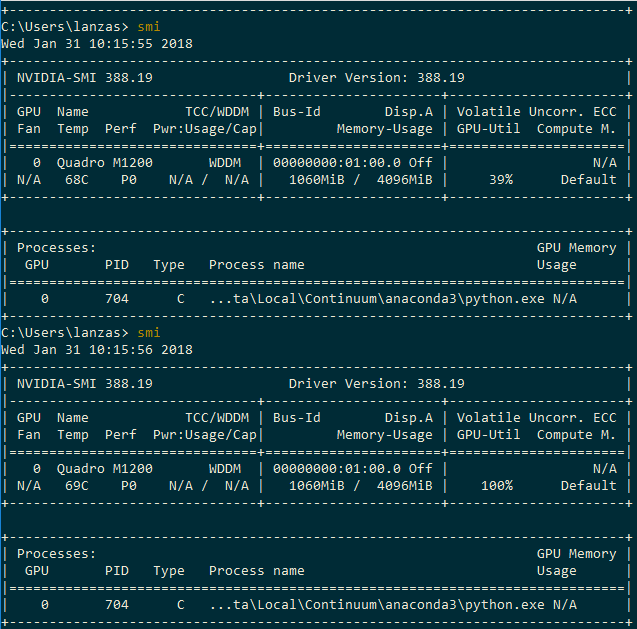
Is there something similar to nvidia-smi in windows? In particular, I’d like to check GPU memory status.
Can you confirm that pytorch cuda memory management functions are not available on Windows (e.g. torch.cuda.memory_allocated())?
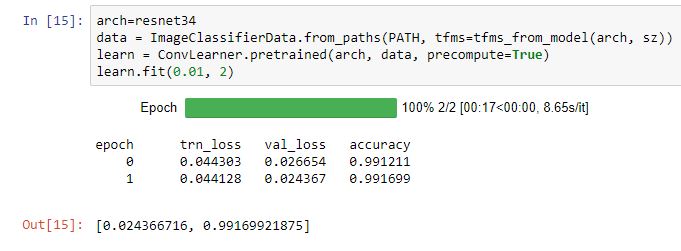
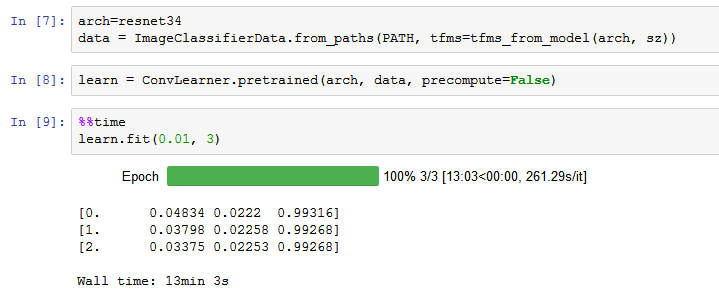
May you post you wall time for the first epoch of the very first example in lesson1 (resnet34)?
TechPowerUp GPU-Z, enable the cuda option to see when cuda operations are running. I think it reports to Memory Usage Dynamic/dedicated under the sensors tab.
that command fails for me “AttributeError: module ‘torch.cuda’ has no attribute ‘memory_allocated’”
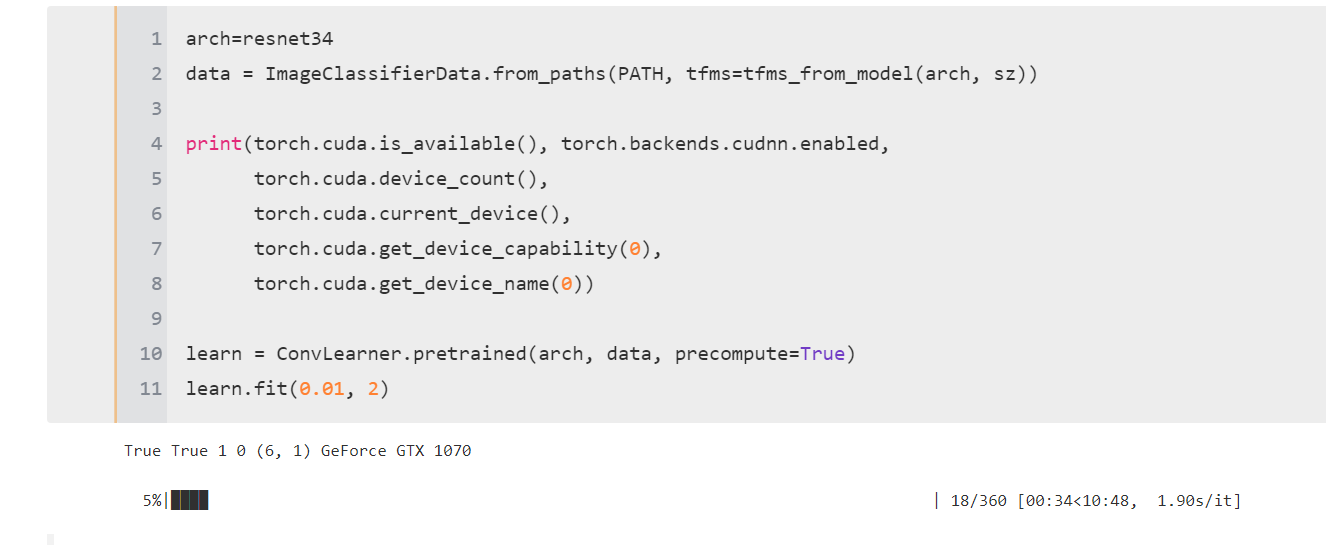
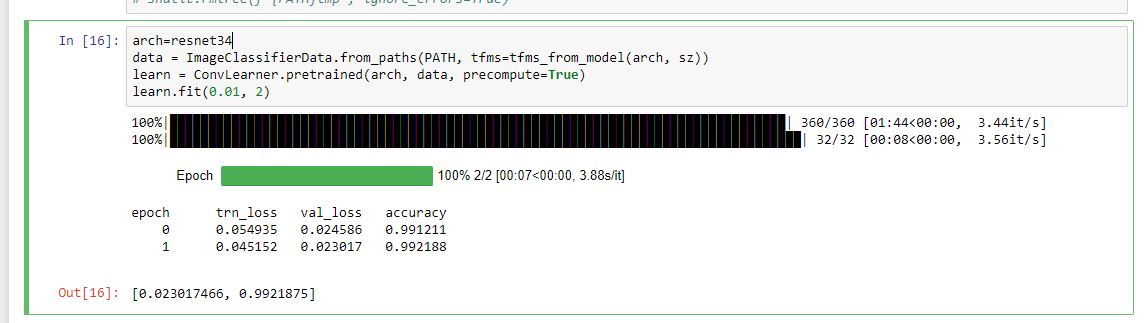
Ok but it should display 2 black bars too. One with 360 iterations, the other with 32 iterations, with relative wall time. Example while carrying out the first one:
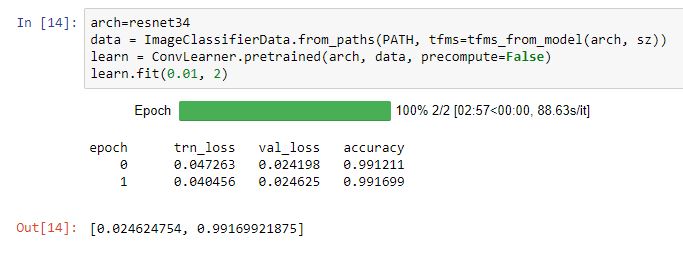
I think you did’t delete your tmp folder, reusing precomputed activations. May you please clean your activations and re-run the same test for me, making particular attention to ETA relative to the first 360 iterations?
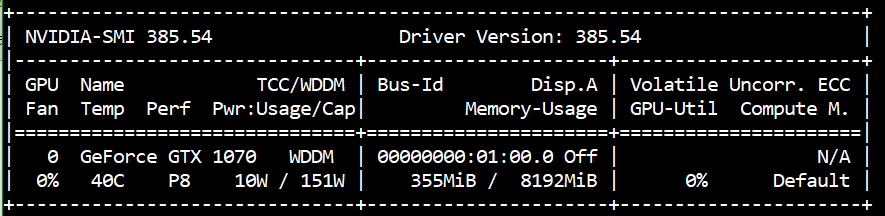
The first screenshot is my baseline gpu utilization by various system tasks. As you may see, there is very little memory allocated, and utilization percentage is zero.
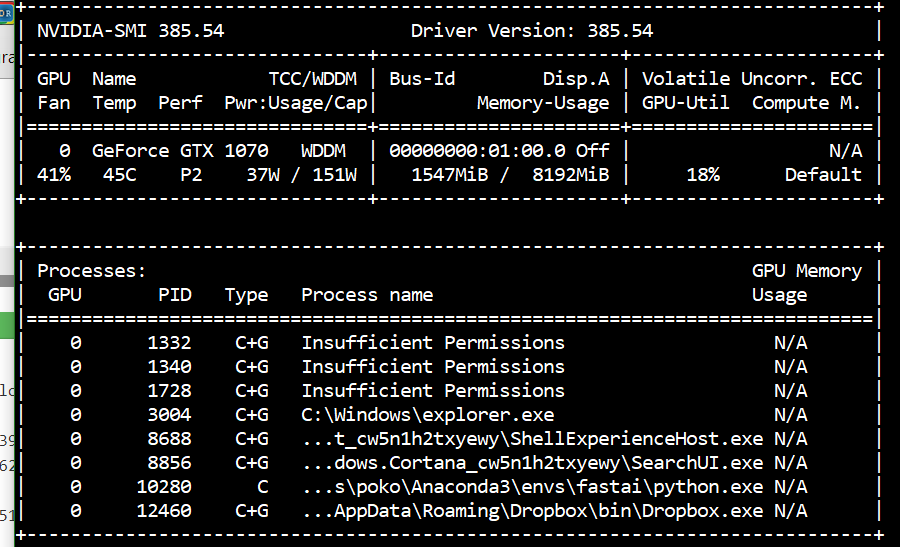
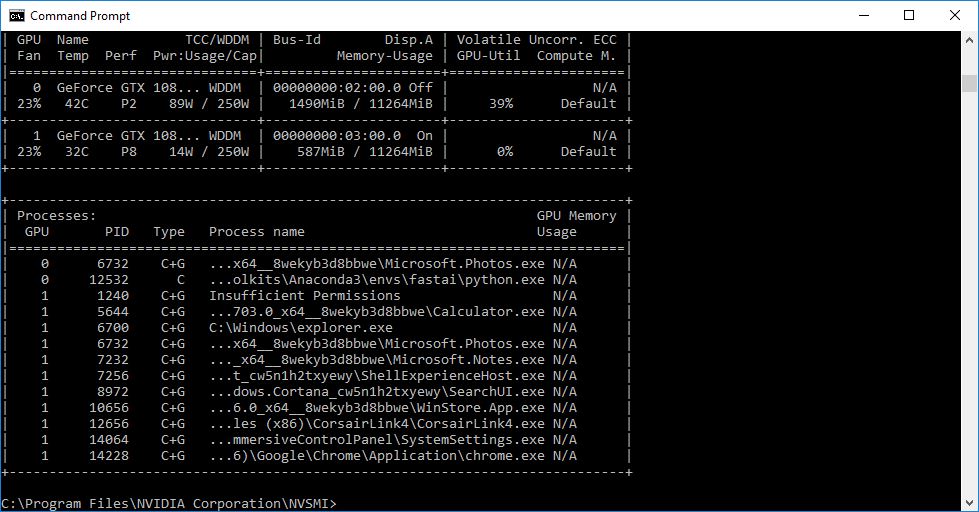
The second one is during the first epoch (no precomputer activations). Note that python from fastai is listed, so it definitely accesses the GPU. More memory has been allocated: 1.5Gb. None the less, the gpu utilization is low, it never goes over 20% over the entire execution, and so is the energy absorbed (~40W over a tdp of 150W for the 1070).
I would be very grateful if you could do the same test (it could be informative for you too).
One thing to be careful of is that your Nvidia GPU isn’t doing any screen rendering. You want your onboard Intel GPU doing all that. Go in to the GPU control panel and make sure everything is set to use onboard graphics. If your Nvidia GPU is trying to do CUDA at the same time as graphics, it’ll kill performance.
That was a good suggestion. Now my monitors are connected to i7 4770 integrated graphics.
All system settings are configured accordingly. Still, the 1070 appears to be almost 3X slower that a 1080ti, which cannot be. I obtained 4:30 minutes, while @FourMoBro obtained 1:44 in 1st epoch.
No problem. Just set pytorch to use a 1080ti which is NOT connected to monitors.
Thanks for having submitted your results. Regardless, it is good to see other italians here on fastai
Thanks @FourMoBro.
It seems that my gpu is used, more or less. My memory and % are not that different with respect to yours. Plus, the CPU % never spikes over 40%, so that task is definitely not performed by the cpu.
It’s just that I am too much behind you. I should be ~80% behind you, not ~250% like I am.
I have the 1070 running at 16x 3.0.
System memory occupation was less than 50%.
There is no justification for such a poor performance. I’ll post others results as I go through them.
Keep in mind that nvidia-smi is a snapshot at the moment you enter the command. it is not dynamic. so, if you want, keep executing the command. you will see temperature change as well as %Gpu utilization. while my utilization % was pretty small in most cases, I was able to see a few times where it hit 90% during rapid re-executions.
If you want to use more of the video ram, you can always up the batch size. I played with the number, doubling it up to 512 (128, 256, 512) with no real degradation in performance time. Your limit for an 8G will be 512 or less as 512 took up over 7GB of ram. setting it to 1024 would fail on my machine with out of memory.
While the GPU is doing the calculations, there still is much the cpu has to do in getting data and writing it. getting batches or whatever. I would be interested to know if you have a spinning/mechanical hard drive or is it a SSD or NVME. If spinning that will probably slow things down tremendously. It would also explain why my times in windows are slower vs ubuntu as my ubuntu OS is on a much faster nvme drive.
back to the cpu, what is your cpu type/model? mine is a 6core, and while learning i can see the temp rise 6C over idle. I guess I am saying that while we expect the gpu to handle the NN calculations, there is still a large OS administration overhead that the cpu has to do.
My system is not a beast like yours, but it’s still pretty quick. I got two Samsung 850 pro 512gb, sata3 (non-nvme). As for the cpu, you are right, it has jobs to do, but during the entire process it was on an average of ~40% utilization, and never over 60% (as per windows task manager).
It is an i7 4770K, quad core, base frq 3.6, peak 3.9, haswell architecture.
I got 16gb of dram, which is not much, but like I said, just 6gb of system ram were occupied (overall!) at the moment.
I’m considering an upgrade, but GPU prices are increasing, and the cpu I want (epyc, for its 128 lanes) requires mobos still scarcely available in Europe. So, instead of building another crippled system, I prefer to wait.
Anyhow, the most important thing is that I am capable of following along with windows.
Thanks, both you and Jeremy have been very helpful.
I guess it’s by default behaviour of you haven’t changed it .
Just to check head over to the control panel of Nvidia an check whether the GPU is also doing graphics rendering
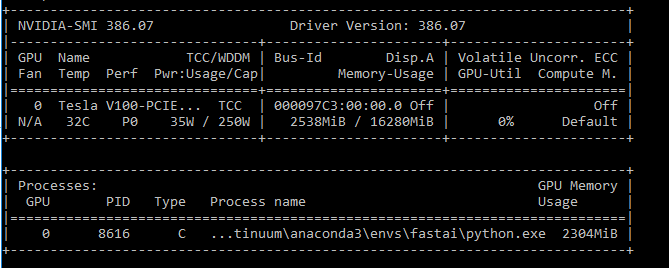
Performance is currently pretty bad for me on a Windows machine in Azure. I have 1 Volta GPU available and the utilization is very spiky. Here’s a peek at the GPU with nothing running:
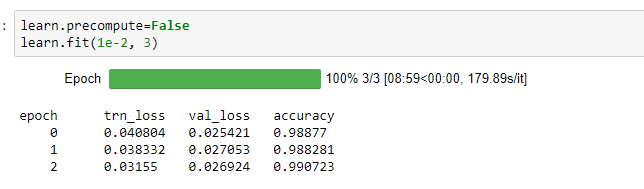
Here’s the test that I ran (9 minutes to run 3 epochs. Yuck!):
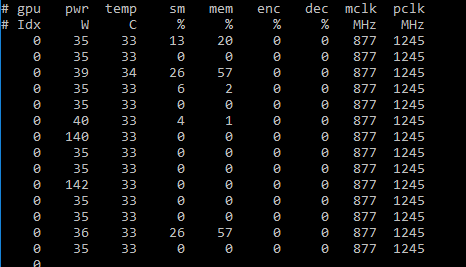
And here is a look at the GPU utilization via nvidia-smi dmon at one point during that test:
Notice how choppy it is. Many cycles without any GPU utilization.