Hey! I’m trying to use the tabular functionality to solve the housing regression problem on Kaggle. I think I did it all right but when I check the size of the shape of the prediction it’s 1459x51 for some reason when I thought it would be a vector (predicted y values). And secondly the values themselves are super small like less than 0 when I expected it to be a lot larger.
What’s going on is that fastai is treating your dependent variable as different classes, and you probably have 15 unique values of sales price so you are getting a single class for each of the values. For predictions, fastai is giving you probabilities for each of the 15 classes, hence why the size is 1459x15 and the values are small.
To fix this, pass inlabel_cls=FloatList to label_from_df to tell fastai to treat the dependent variable as a list of floats rather than a list of class labels.
2 Likes
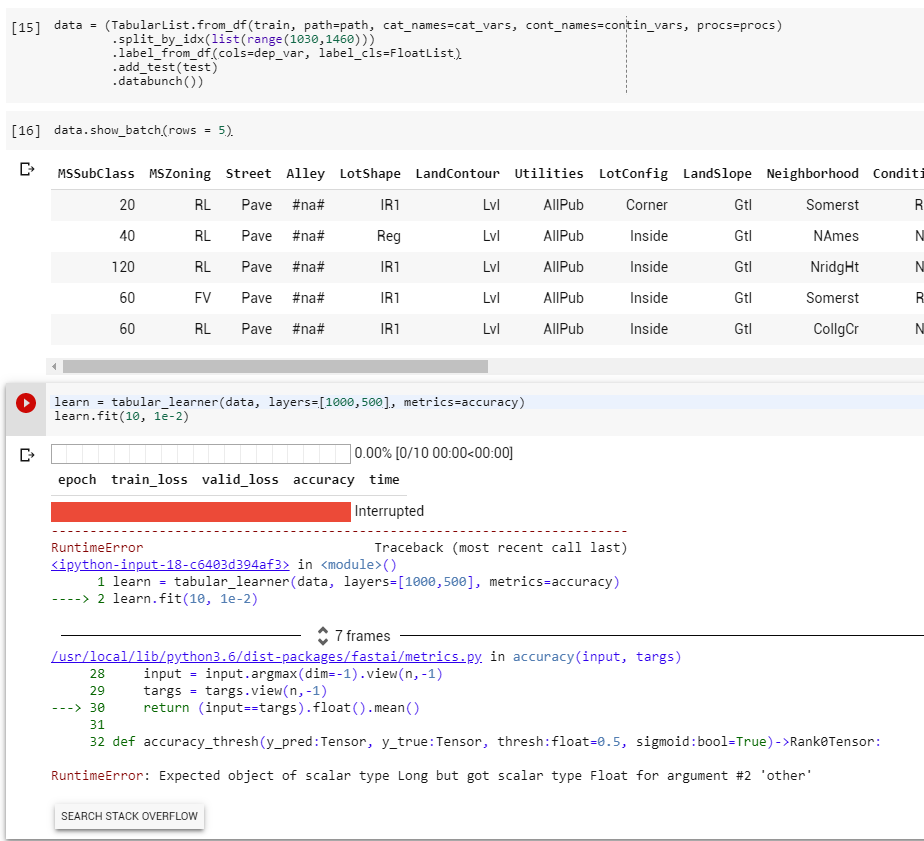
Ohh gotcha, thanks! I added that in as you can see and I tried running it again but I got this error this time instead. And that makes sense as to what went wrong but I’m sure I have more than 15 unique values of sales price but yeah haha, thanks!
This has to do with the metric that you chose: accuracy.
Accuracy doesn’t make much sense for a regression problem. Try choosing a better metric. What is the metric that the competition uses?
Ah thought so, in the competition they use root mean squared logarithmic error
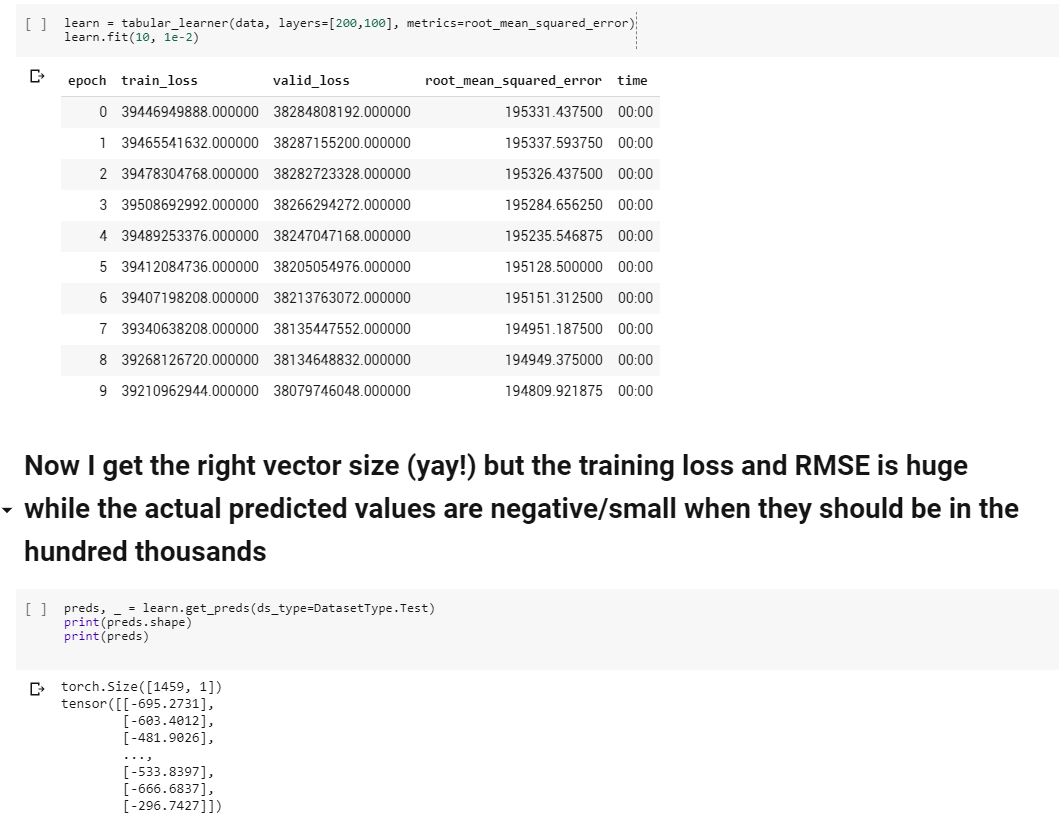
I got it to work! But now the training loss and RMSE is huge (Is there a way to get the RMSLE) while the actual predicted values all seem to be negative/in the hundreds when they should be in the thousands range.
Hi. Did you find a solution on this? I am working with the walmart competition and I am getting numbers worse than with LightGMB. I am using metrics=rmse.
Each epoch gives me better and worst results. It does not consistently improve as I have seen in the course.
This is my learner
data = (TabularList.from_df(X_train, path=’.’, cat_names=cat_names, cont_names=cont_names, procs=procs)
.split_by_rand_pct(valid_pct = 0.2, seed = 42)
.label_from_df(cols = dep_var, label_cls = FloatList)
.add_test(test)
.databunch())
learn = tabular_learner(data, layers=[ 1000,500], ps=[0.001,0.01], metrics=rmse, callback_fns=ShowGraph)