I’m running numerous hyperparameter sweeps on a project right now. While it’s nice to look at a spreadsheet of Mean Accuracy vs Hyperparameters and take guesses at what parameter tweaks are improvements, it’s hard to know which tweaks are actually significant improvements and which are just noise. Even at 20 averaged runs each.
So I started using K-S significance tests to compare experiments. Not only that, I integrated the significance tests into my result DataFrames. My new tool allows me to pull up a set of hyperparameters, see all nearby hyperparameters, and see which of those nearby tweaks gave significant results.
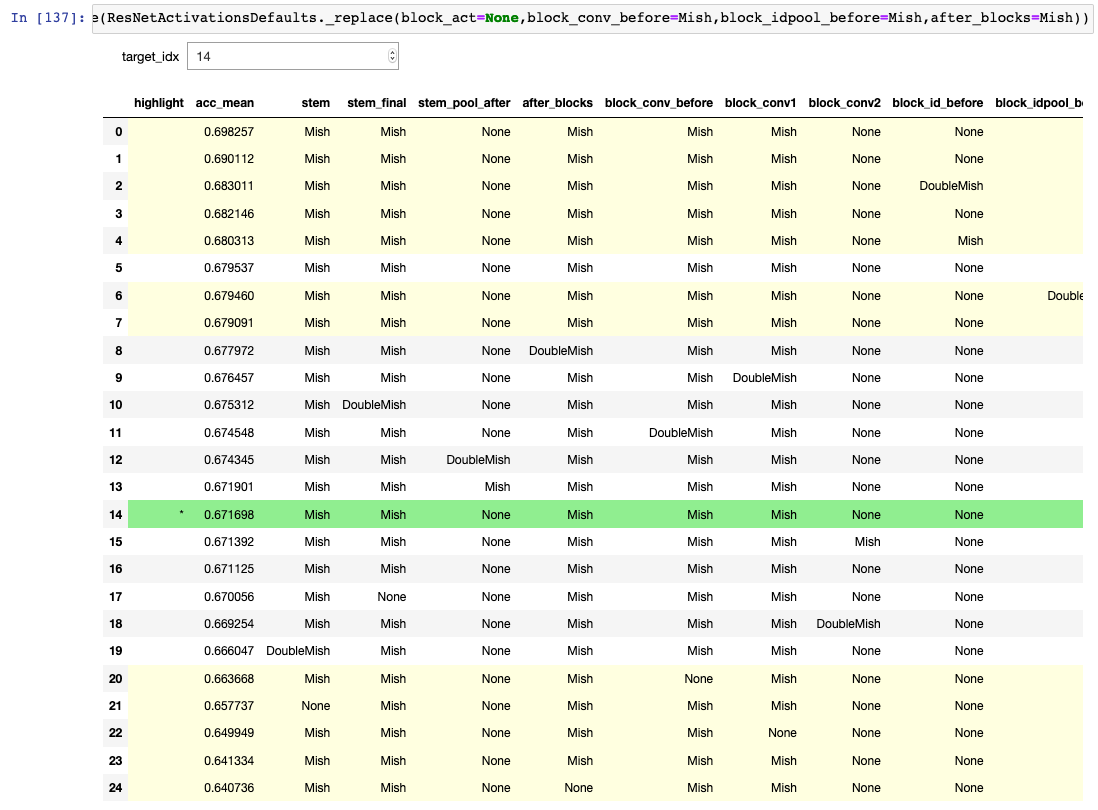
Here’s what it looks like:
Here’s the code snippet:
P_VALUE_THRESHOLD = 0.05


def interactive_significance(target_act_config):
    rows = rows_within_one(target_act_config)
    df = export_to_dataframe(rows, highlight=target_act_config)

    # Initially target the target_act_config row
    try:
        initial_idx = [x['act_config'] for x in rows].index(target_act_config)
    except:
        initial_idx = 0

    interact(significance_highlighter, target_idx=ipywidgets.BoundedIntText(value=initial_idx, min=0, max=len(rows)-1, step=1), rows=ipywidgets.fixed(rows), df=ipywidgets.fixed(df))


def significance_tester(rows, target_idx, val):
    idx = val.name
    accs = rows[idx]['accs']

    if idx == target_idx:
        return ['background: lightgreen' for _ in range(len(val))]

    _, pvalue = ks_2samp(rows[target_idx]['accs'], accs)
    significant = pvalue < P_VALUE_THRESHOLD
    return ['background: lightyellow' if significant else '' for _ in range(len(val))]


def significance_highlighter(rows, df, target_idx):
    return df.style.apply(partial(significance_tester, rows, target_idx), axis=1)
That’s pulled right out of my notebook, so it references other functions, but hopefully it gives the general idea and can be adapted if anyone is interested in using it for their own data analysis. It leverages IPyWidget’s interact, running ks_2samp to compare the accs of the target row versus all other rows (where accs is a list of resulting accuracies from all runs for a particular configuration). It can then apply a style to each row. The target row is highlighted in green, significant results (relative to the target row) are highlighted in yellow, and insignificant results are not highlighted.
How I use this in practice is that I start from a set of parameters, do runs on nearby parameters, then see what results were significant. I then repeat that process on all significantly better results. And so forth, walking the tree. In my case I’m not necessarily interested in the best set of parameters, but more in the behavior of the architecture, so this tool also allows me to see not only what parameters are important, but also which aren’t important.
Some major caveats:
- I’m terrible at stats, so take this tool with a grain of salt.
-
ks_2sampis, AFAIK, not the best tool for the job, being a relatively weak test, but I didn’t know if theaccsdistributions were always Normal so I opted to use a more general test. (In fact some could not be proven to be Normal when I checked a few) - As always, the more
accsyou have per row, the stronger the significance test can be. - This is basically P-hacking on crack. Live by the Null, die by the Null.