I am writing a custom data class that could show an image together with its mask. The plot I want is something like the visualization that you see in CAMVID example, except I wanna implement a custom data class to visualize that (I needa write a custom data pipeline because my data structure is a bit hard to fit the default DataBlock setting).
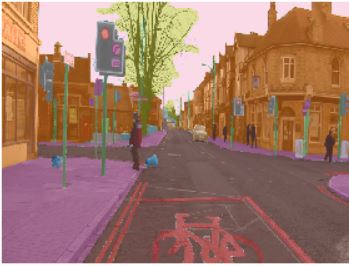
That’s an example of visualization I want (from CAMVID):
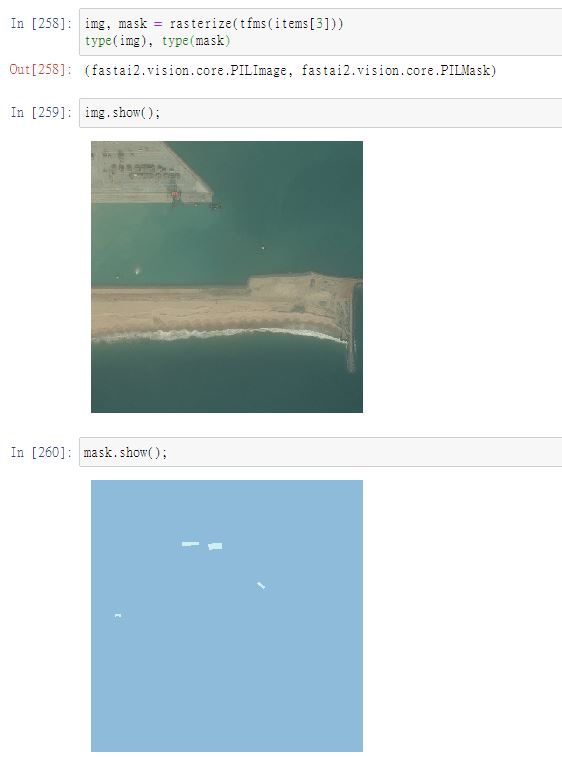
And here is an example of what my data looks like (its from Kaggle Ship Detection competition):
I simply implemented a custom data class as follow that intake PILImage and PILMask and show them as one image with two items overlay:
class LabeledImage(Tuple):
    def show(self, ctx = None, **kwargs):
        img, mask = self
        ctx = mask.show(alpha = 0.5)
        return img.show(ctx = ctx)
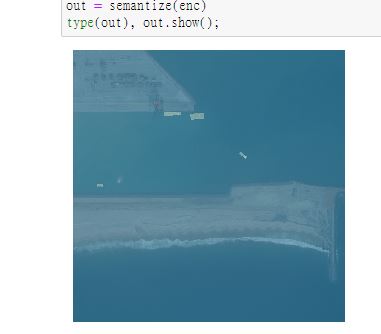
But it seems not to work, that’s what I got when showing the instance:
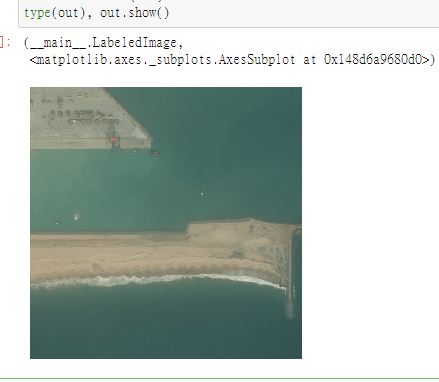
Could any fellows give me a guide on how to make it work?