Hey, I am comparing different weight decay values using the LR finder technique (note that i am not using the fast-ai version but this github implementation)
I am not sure on how to correctly interpret the different curves sinces they are very similar:
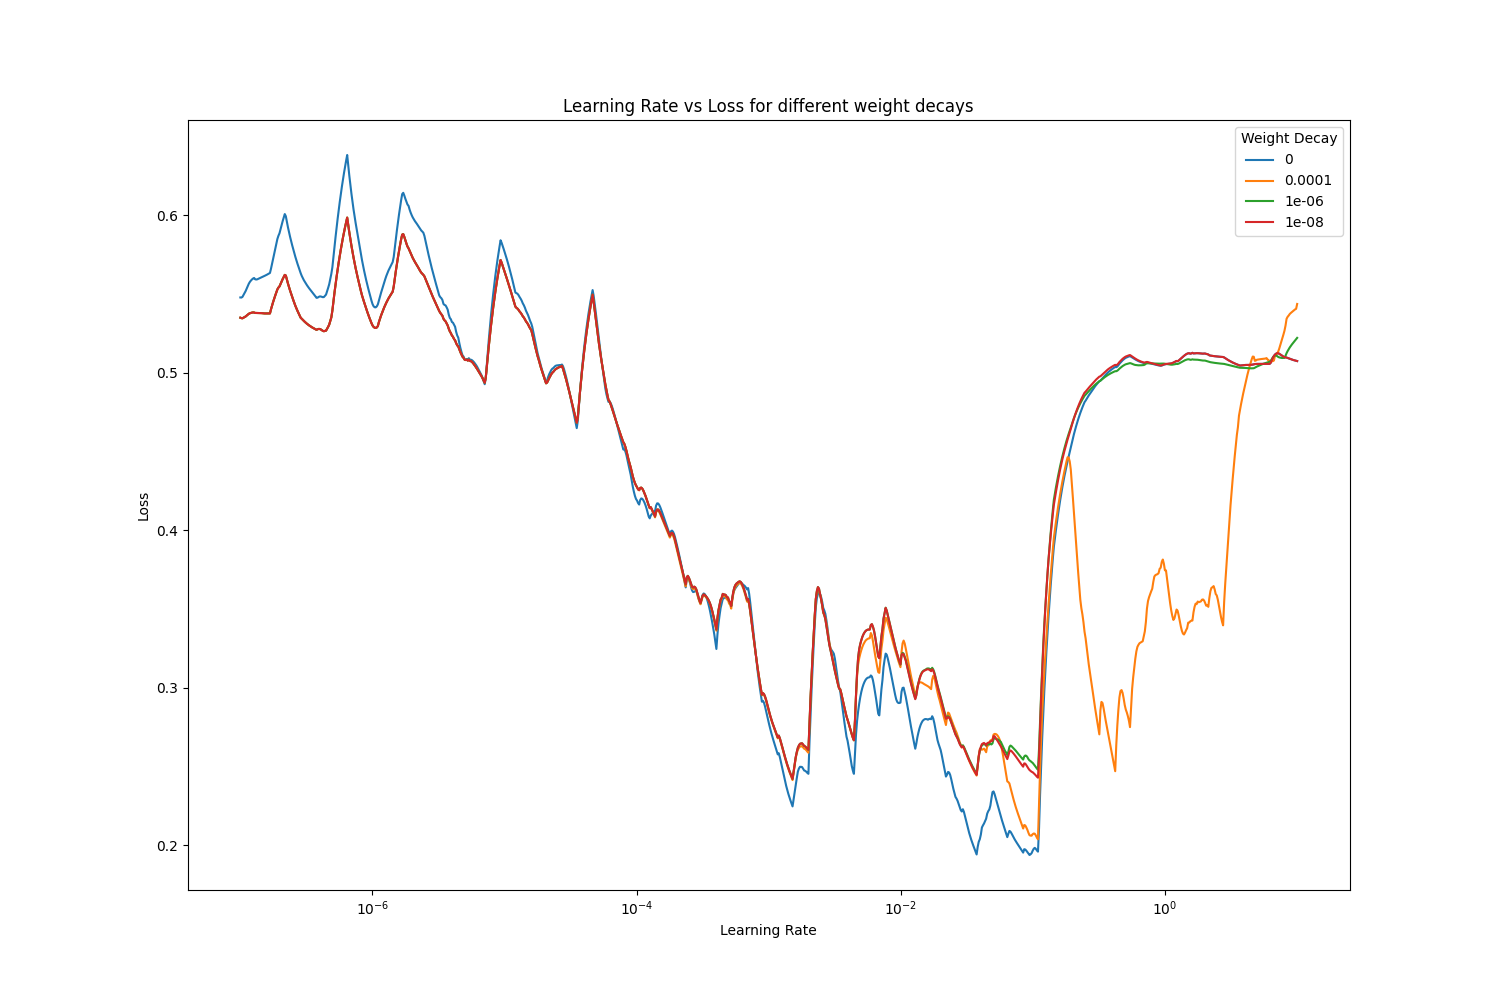
If you take this as an example, the curve of wd=0 achieves overall a lower loss, but 1e-8 is lower at the beginning where the lrs are very small.
Can someone help me to interpret these curves correctly?
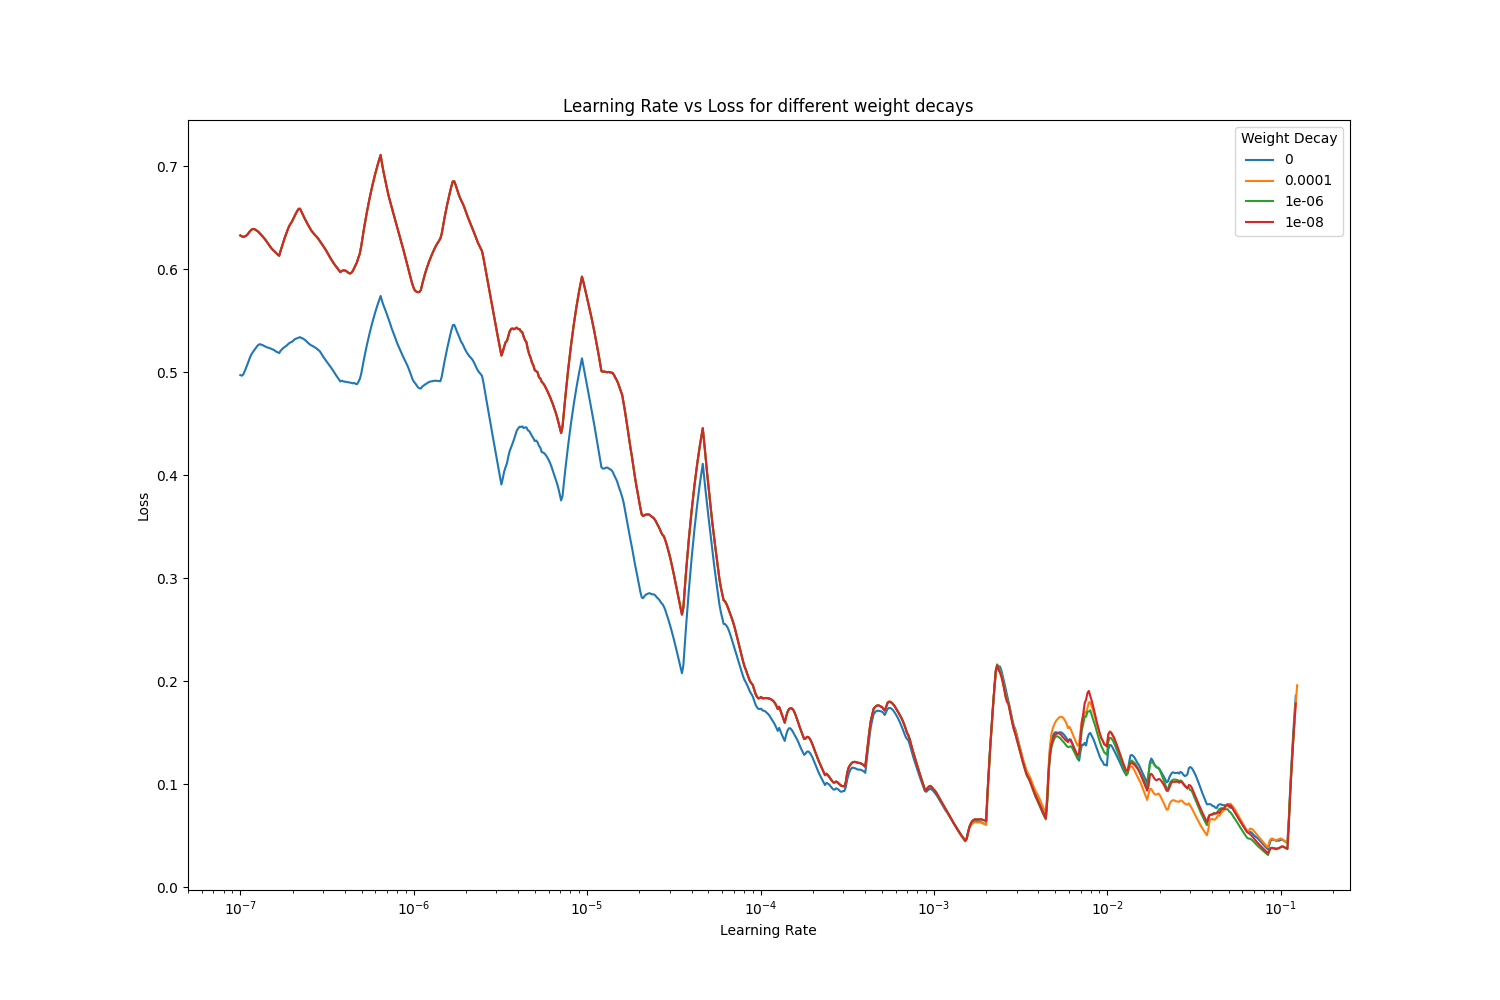
In this image the difference at the beginning is even larger while the difference seem get smaller the higher the lr gets.
What makes one curve “better” than the other?
Maybe one of you can help me and explain it to me 
(I am comparing different versions of DeepLabV3+ on a custom semantic segmentation dataset)
Cheers
Sven