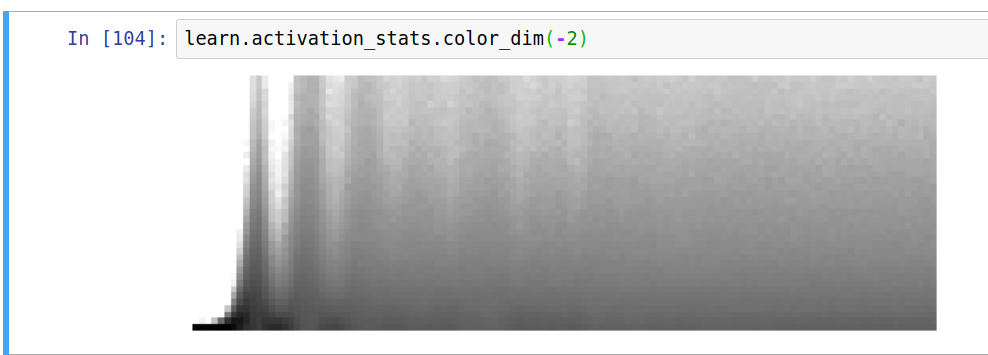
I was trying to visualize the activations of my training using the color_dim method in the activation_stats callback and noticed that they’re outputting black and white representations rather than the prior color ones? Is this a bug or am I doing something wrong?
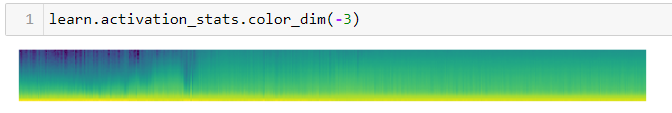
Mine is as expected with the default viridis cmap.
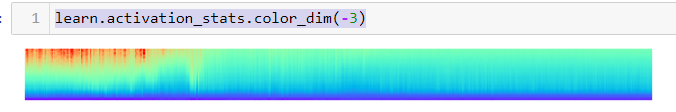
Maybe in your notebook you have the default changed to something else. You can change it by doing this:
matplotlib.rcParams['image.cmap'] = 'rainbow_r'
learn.activation_stats.color_dim(-3)
9 Likes