Hello everyone, I have written a tool I’ve found quite useful in a couple of my image classification experiments. Here is how it works:
- It covers up a small square of the input image, and sees how the prediction for the correct class changes
- It slides this window across, repeating the process for every square in the image
- It outputs a heatmap, which indicates how important each square was to the prediction (eg. if the prediction was much lower with that square covered, then it was important)
Here is a sample output:
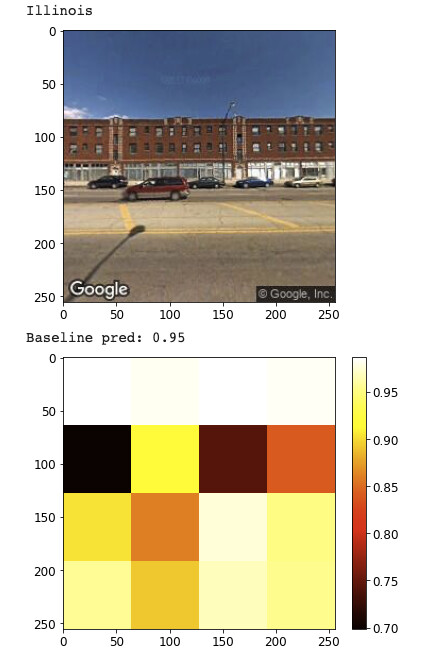
The model is trying to classify the state. The correct label is “Illinois,” which the model originally predicted well (0.95). We can see the prediction drops to ~0.70 when some of the cars/building is covered, but does not drop when the sky is covered.
Is this something that already exists in some library? If not, is this something other people would be interested in using? If so I can share the code