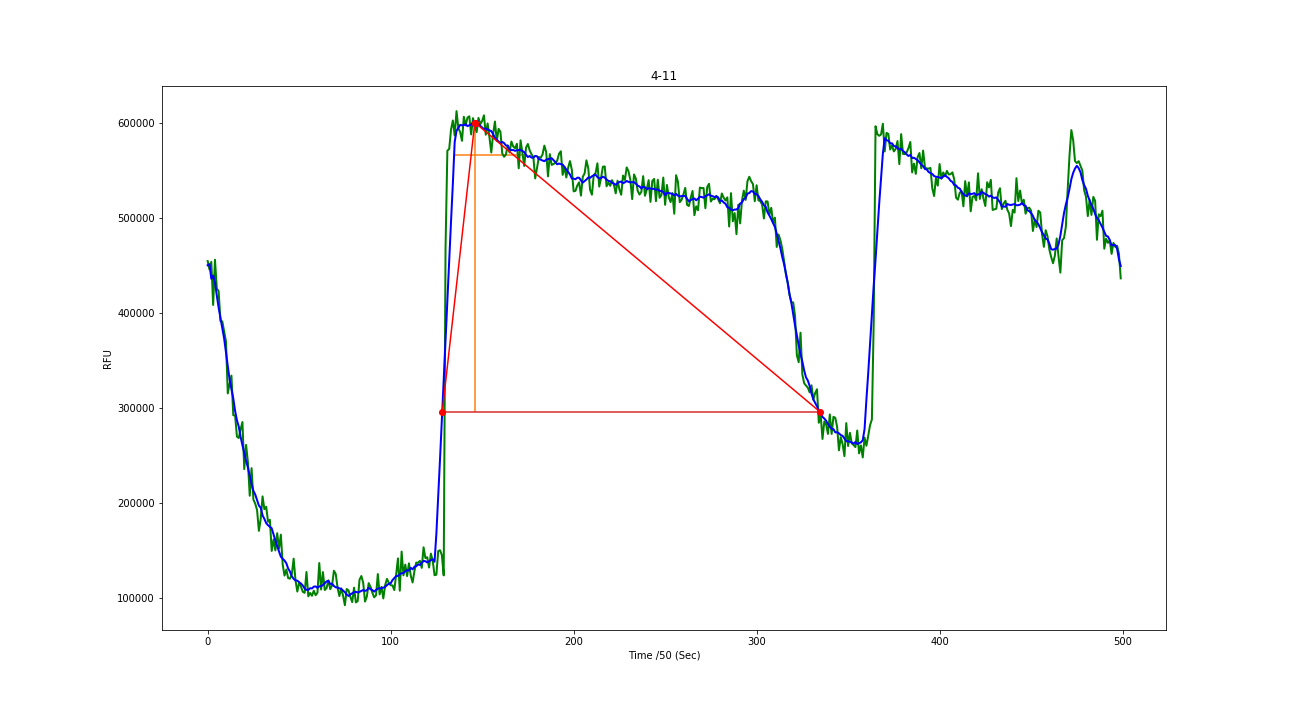
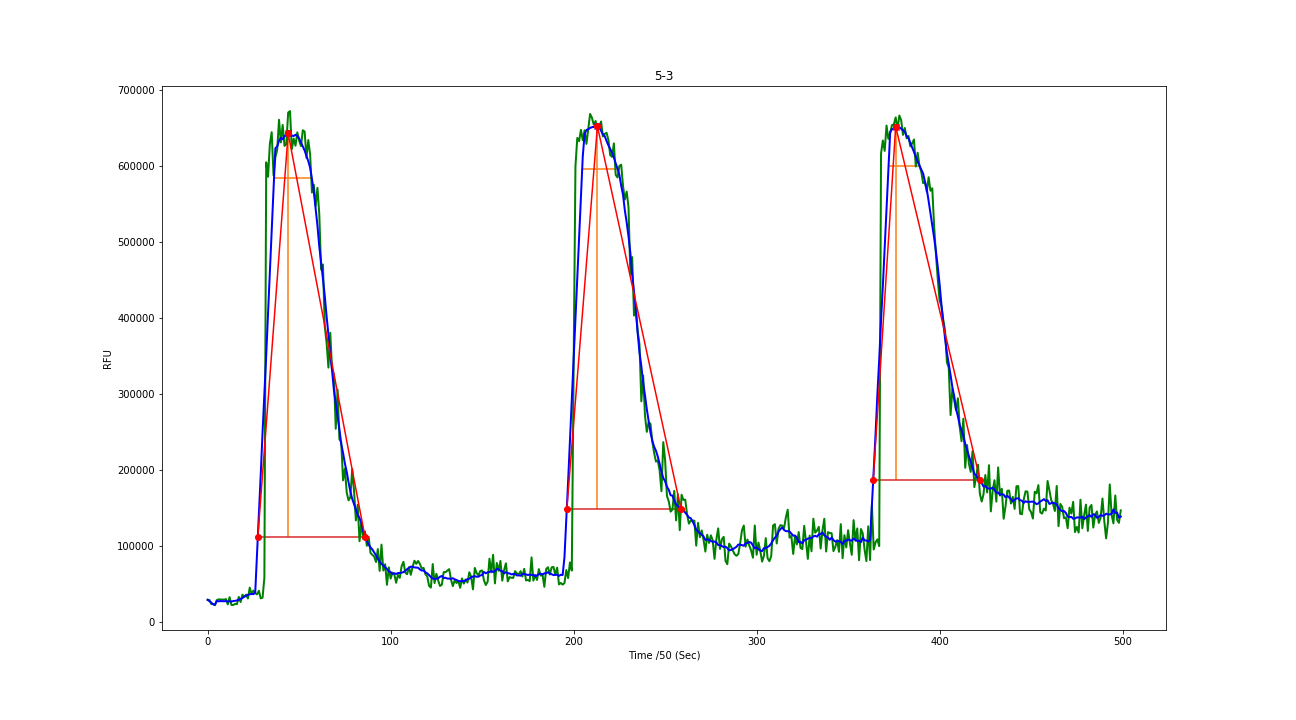
I am working on Ca flux dataset. Basically, it is fluroscent readings measured in 500 times in 10 seconds for a given experiment. I have such 500 readings for 200 + experiments. I use these value to plot the graph and look at it. Following are some of the graphs showing 2 different signal pattern .I was wondering if I can use these numerical values to build a model, which can identify the type of pattern? Any starting points will help. I am seeing tabular data classification tutorial. Should I follow that?