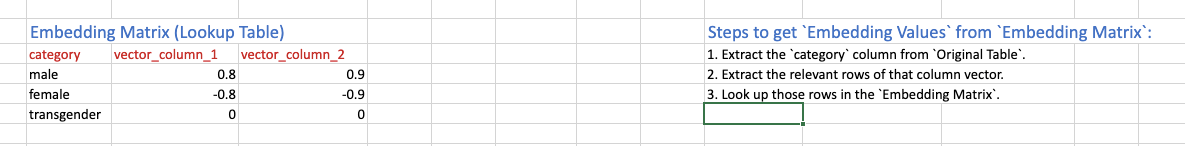
In the above Excel, the values in “Embedding Matrix (Lookup Table)” are randomly initialised. Then, they are learned through stochastic gradient descent.
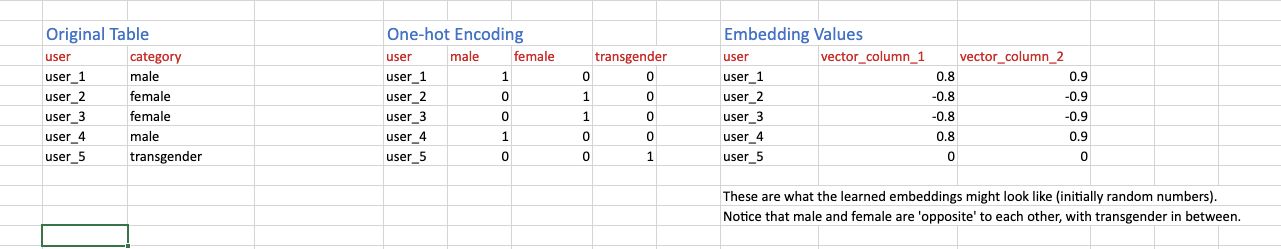
So I didn’t “calculate” the “Embedding Values”. I guessed what the “Embedding Matrix” might look like after training is over. The actual learned values in the matrix might be different (depending on your dataset).
Don’t try to understand vector_column_1 and vector_column_2 separately. Instead, take the entire vector. For male, this is (0.8, 0.9), and for female this is (-0.8, -0.9). These are just points in 2D space.
So embeddings try to represent real world concepts (gender in this case) as vectors (points) in N-dimensional space. How many dimensions is your choice as a data scientist. In this case, I’ve chosen 2 dimensions, but you could have chosen 3 or more.
@sambit, thanks for the explanation and video. They were both really helpful.
So, if I understand things correctly, an embedding matrix is a randomly initialized matrix of with a manually selected number of columns. The neural network learns the weights in the embedding matrix so that each point in the vector space corresponds to a unique class in the categorical variable?