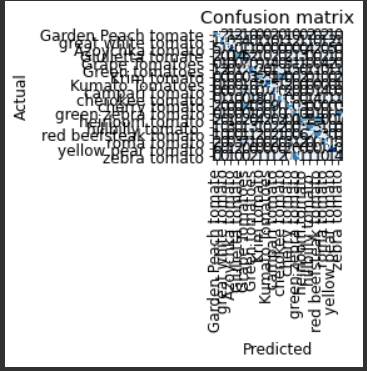
How can the ‘confusion matrix’ be made larger size because the model I am working with has many categories and running the function in Colab overlaps the data making the result totally unreadable.
Thanks
How can the ‘confusion matrix’ be made larger size because the model I am working with has many categories and running the function in Colab overlaps the data making the result totally unreadable.
Thanks
Could you try passing a figsize argument to the function that does the plotting, like: interpr.plot_confusion_matrix(figsize=(20,20))?
Thank you!!