This is in continuation of my series on finding out how the fastai library works. For my earlier post on the same please go here. I was looking at how the epochs, training loss, validation loss and any chosen metrics (like the accuracy that we set for the model) are calculated and printed in the note books when we learn.fit or learn.fit_one_cycle.
Fortunately I was following the FastAI Internals Webinar Series hosted by @aakashns. For those who are interested in having a look at that series you can find the entire playlist here. Thanks to him and the series I was able to understand that this is handled by the callbacks in fastai library. Then I took it upon me to run the code and find the internal process within fastai. Thanks to @deepanshu2017 who introduced me to %debug in Jupyter notebook, I was able to do that.
To start with let us understand the meaning of a callback. As per Wikipedia, a callback, also known as a “call-after” function, is any executable code that is passed as an argument to other code that is expected to call back the argument at a given time. So basically it is a function that you can pass as an argument or object within another code.
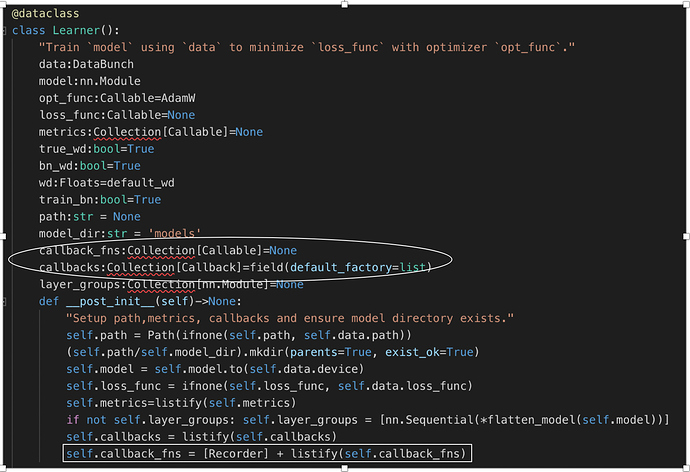
Having understood the meaning of a callback, let us turn towards the Learner Class. This is what we use and call in our Lessons most of the time. So when a Learner Class gets created, you will find that amongst the many default parameters that is has, one of them is Callback functions. Also it has a __post__init function which sets the callbacks functions to a function called Recorder. For you to follow along what I am talking about, I have attached a screenshot of the same.
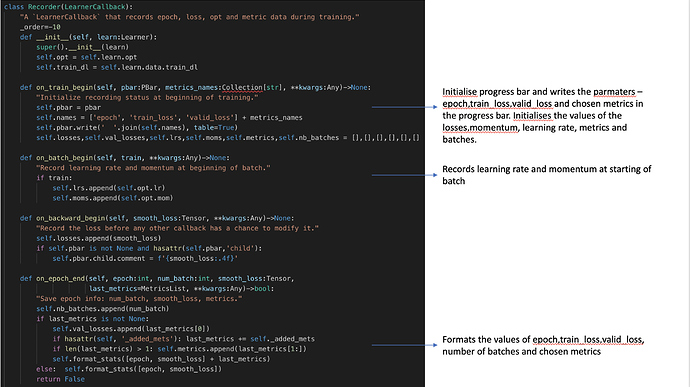
If you recall from the lessons, Recorder is what we use to plot the learning rates and the losses (learn.recorder.plot() and learn.recorder.plot_losses()). On closer examination of the Recorder, you can find that this is an instance of a Learner Callback Class. Also you can find that it has many other methods within it apart from plot() and plot_lossess(). The methods that are of interest to us in this case are on_train_begin(), on_batch_begin(), on_epoch_end() and format_stats(). For a quick and easy of what these methods do, I have attached an image below.
So as you can see the on_train_begin() helps to initialise the progress bar that we see along with the titles like epoch, train_loss, valid_loss and the metrics chosen by us. Their values are calculated every batch and updated. Also as Jeremy mentioned in this lectures, the losses are smoothened and only their moving average is shown so as to take the bumpiness that may arise in every batch calculation. At the end of the epoch the values are formatted and then displayed to us in the notebook.
Let me also explain the complete process of what happens when we use learn.fit_one_cycle(). This will help to fit in as to how and where various functions are called. The learn.fit_one_cycle() in turn calls the fit() method in the Learner Class which in turn calls the fit() method in the basic_train.py. It is in this last function that the Recoder which is a Learner CallBack Class instance is invoked and its various methods that I described above are used. Please note that as a part of the callbacks a lot of parameters and functions are passed on throughout the process.
They include the callback functions like Recorder, the complete model that we use to create the Learner, the image list, the label list and the path wherein the data is held to name a few. Please find the link to a detailed document wherein I have captured the process from a line by line code execution perspective. As mentioned in the start, I used the
%debug
before I ran
learn.fit_one_cycle()
and then it gives me the option
ipdb
during runtime to see what happens. I wanted to mention a few tips for those who don’t know the commands to use in this debugger.
- s - to go inside the function or the code. This is what you will use at the first ipdb prompt when you run using what I have listed below as it has several lines of code inside it which we don’t see.
- n - to go from one line of code to the other after you see the internal code. For example once it goes the def fit_one_cycle() function and shows the various lines of code, you will use ‘n’ to go line by line.
- At any stage if you see a parameter that has been executed and updated as a result of a line of code being executed, you can write the name of the same and see its values. For example, in my case once I saw the callbacks being appended in a line of code and I wanted to see what is in the same, I typed ‘callbacks’ at the ipdb prompt post the execution of the line of code that appends the callbacks.
- r - to exit the function
- p - to print what you need
As a followup to this, please also read the post by @hwasiti , post by @binga, post by @Ducky and post by @cedric who have gone on to customise the callbacks to let them know the status of the training of their models on their mobile devices.
Hope this post was informative and helped to understand some of the inner workings of the fastai library. It definitely helped me and hope that it does the same for all of you as well.


