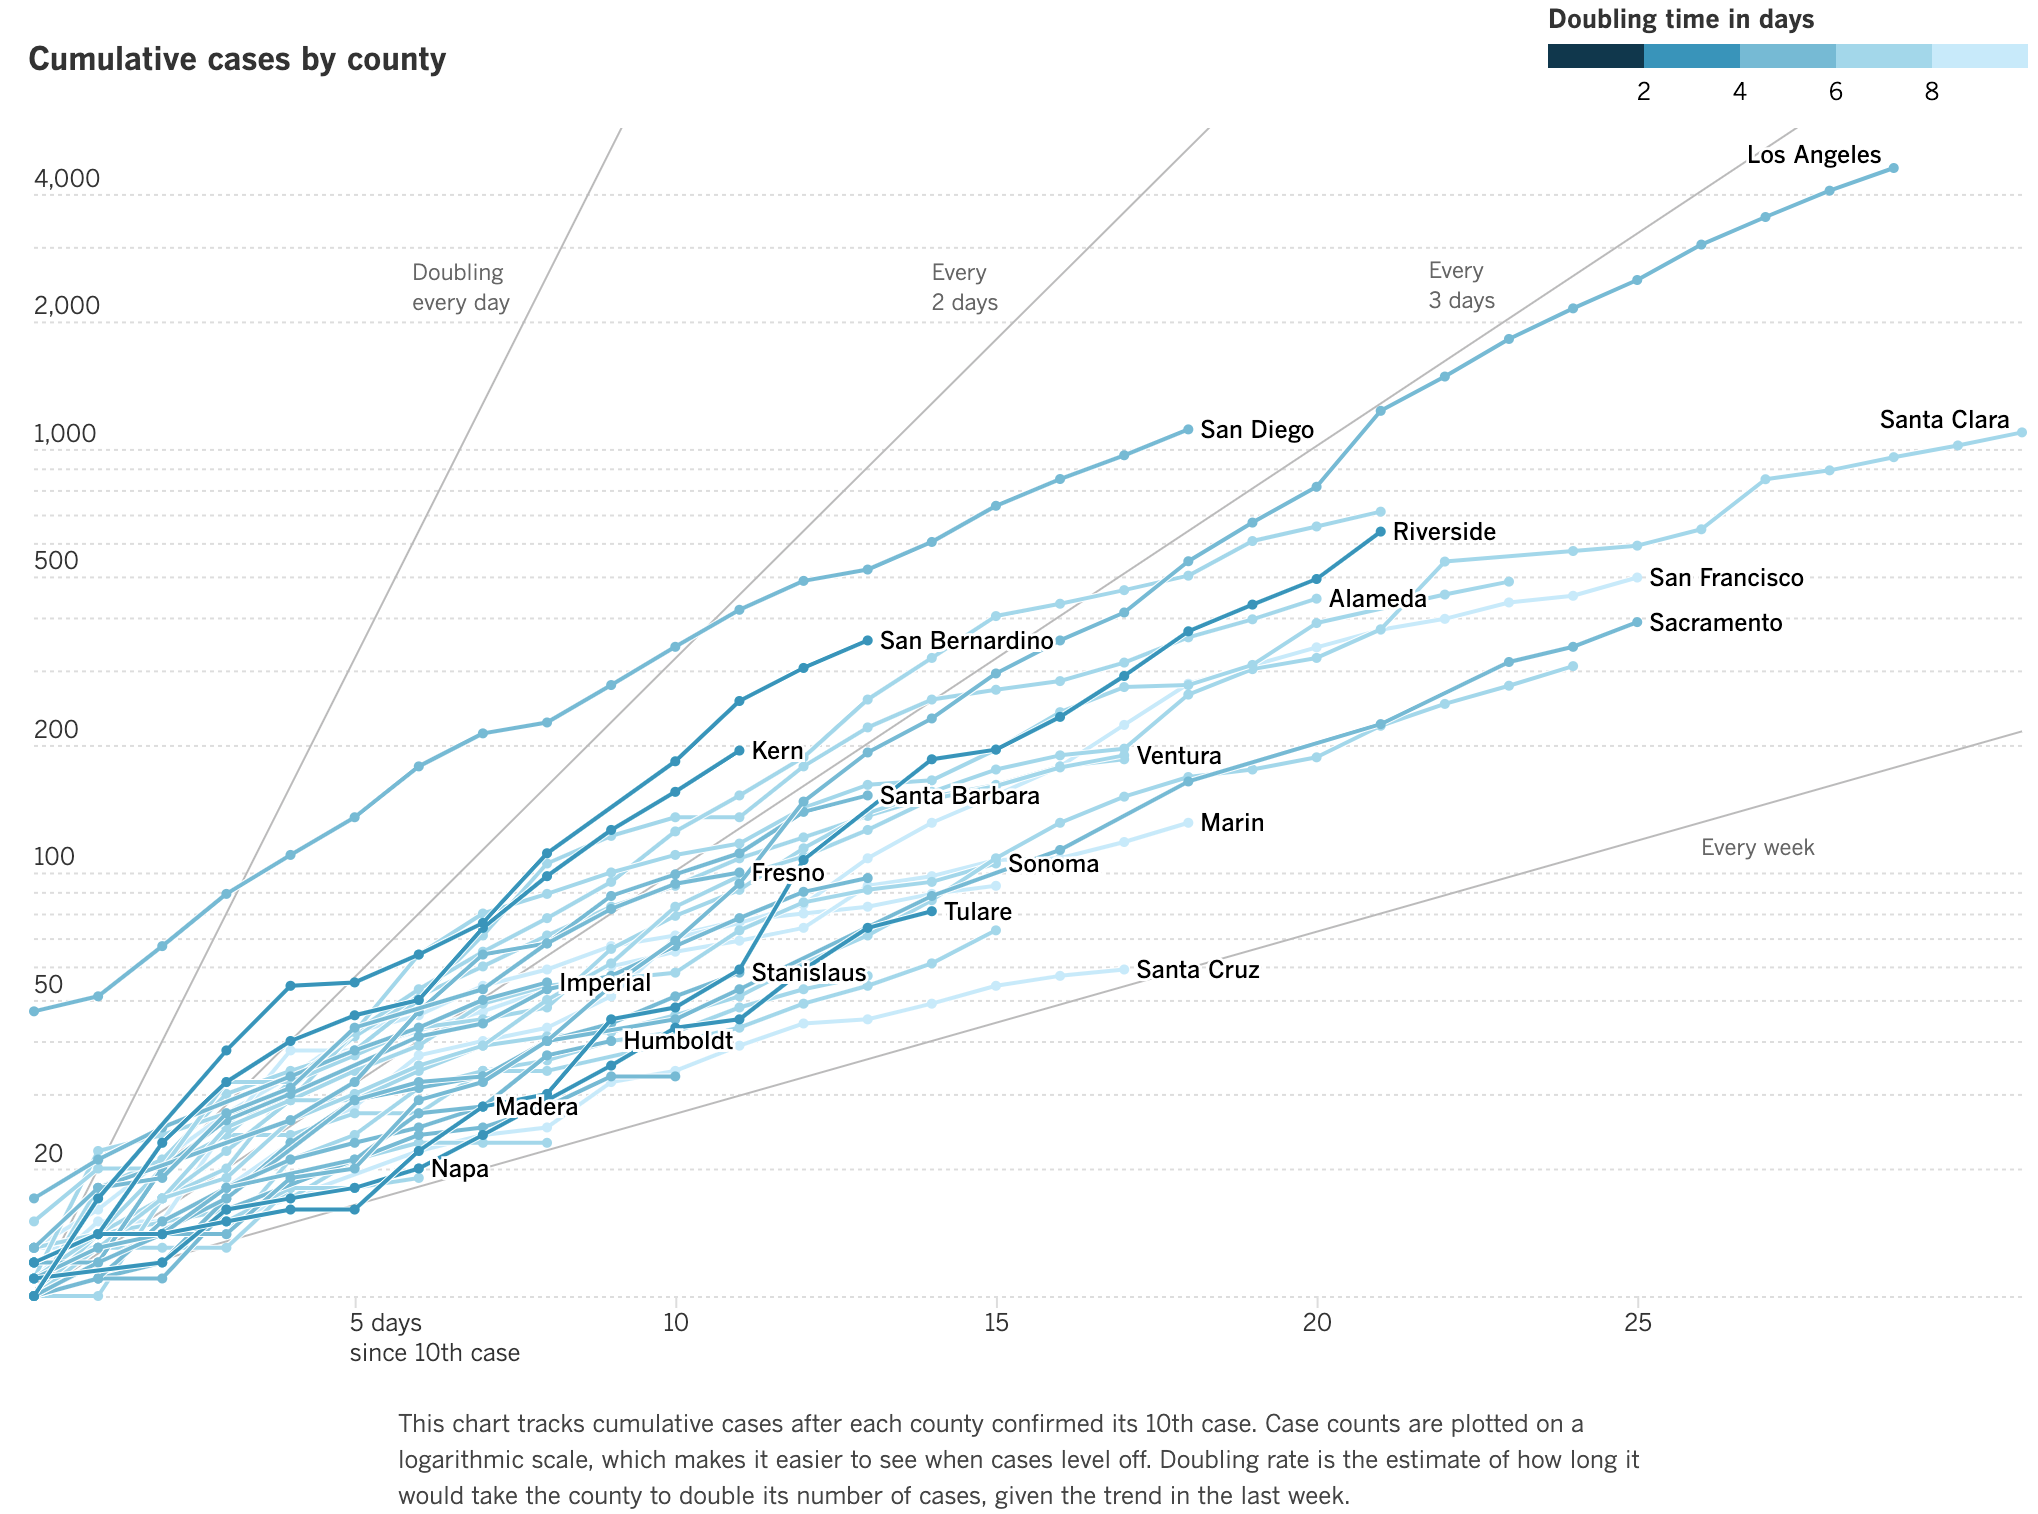
I found this amazing interactive graph of Covid growth (on a log scale) over time, for each county in California. It is on the LATimes.com news site, and probably requires a subscription ($14/mo). This is just a screen shot, but in the real thing you can hover over any line to see which county it belongs to. It lets you easily see the doubling time of new cases per county, so you can see whether government initiatives are succeeding (Spoiler alert - they are not). You could create your own version of this app (or better) using the freely available datasets at Johns Hopkins.
https://www.latimes.com/projects/california-coronavirus-cases-tracking-outbreak/#nt=1PromoSuperLeadLarge-1col-7030col1-mainnt=1PromoSuperLeadLarge-1col-7030col1-main