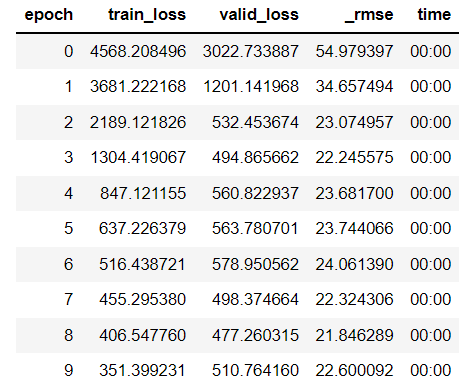
hi there, im a relatively new user to fastai, i have been trying to build a model to predict water level fluctuation using a tabular data representing metrological data. i have face many issues which i hope will find an answer to, first my model RMSE is ~20 down from 60 after 20 epoch (and also tried to use the lr_finder). these are snippets of my data and code:
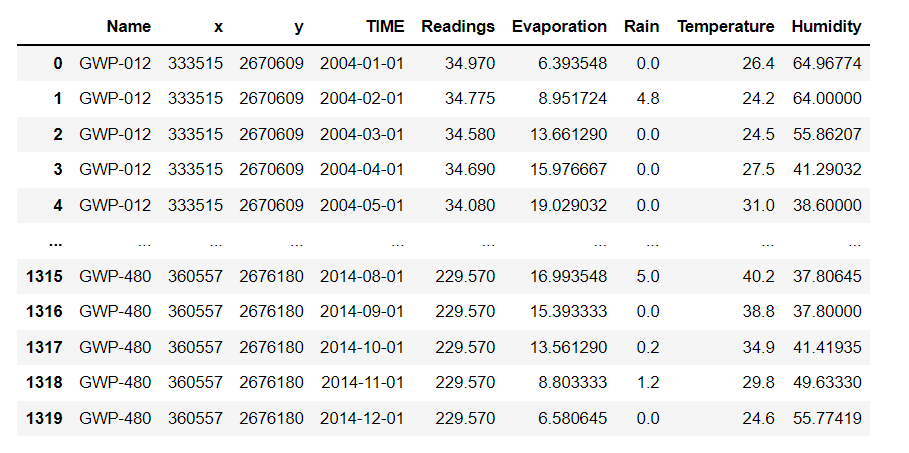
cont_names=[ ‘Evaporation’, ‘Rain’, ‘Temperature’, ‘Humidity’]
cat_names = [‘Name’,‘TIME’, ‘x’,‘y’]
procs=[Normalize, Categorify]
y_names=‘Readings’
splits= (samplist,valist)
to= TabularPandas(GWL, procs=procs, cat_names=cat_names, cont_names=cont_names, splits=splits, y_names=y_names, y_block= RegressionBlock())
y=to.train.y
y_range=((y.min()*0.8,y.max()*1.2))
dls = to.dataloaders(32)
learn = tabular_learner(dls, layers=[200,100], opt_func=Adam, metrics=[rmse], y_range=y_range)
learn.fit_one_cycle(10)
now to my questions:
- how can i get the RMSE to something that is remotely reasonable , what am i doing wrong?
- i have tried different opt_func and loss_func, as well as different number of layers, nodes and other hyperparameters (batch size, etc.) but the results didn’t change much?
- keeping the settings the same, each time i run the code it gives me a vastly different result at the start but soon it get better and stops at ~20 rmse. should i keep restarting the code until i get a satisfactory result?
- i kinda understood why we need to use w_range, but didn’t understand why we need to use RegressionBlock.
- since my problem is time series, i wasn’t sure to treat my date data as cont or cat, i chose the later but your opinion would be much appreciated.
- is there any need to use the name of the station in the Neural network? especially since im feeding it the x,y coordinate?
- my data have gaps but i didn’t like fastai approach to fill them, so i used pandas interpolate which use LR to fill them, can this case the high rmse somehow?
finally, thanks in advance for any kind of help, i have had these questions for almost two weeks with no answer.