What would be the best way to plot the training and validation loss for each epoch?
Thanks,
What would be the best way to plot the training and validation loss for each epoch?
Thanks,
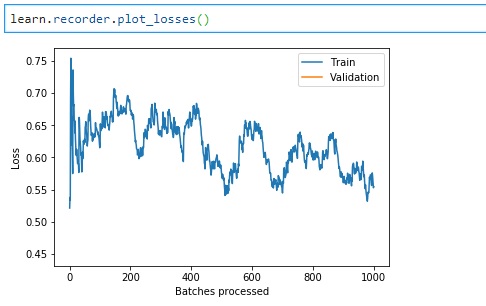
You can do learn.recorder.plot_losses() or you mean updating the graph while training?
But this doesnt get plotted after each epoch right? If you fit for 4 epoch for example.
No, just at the end after the training is finished. So you want something like the example here?
hi ,
Why the below code is not showing the validation loss using the recorder? Do I have to have change something in the databunch .
bs = 8

tfms = get_transforms(flip_vert=True)
data = ImageDataBunch.from_df(".", image_dataset, ds_tfms=tfms, size=450, bs=bs).normalize(imagenet_stats)

learn = cnn_learner(data, models.resnet34, metrics=accuracy)
.....Have more training cycles in between
learn = learn.load("stage-2")
learn.fit_one_cycle(1)
Same question as @jbo. Can someone please explain?
@margiki @jbo you will only have one validation loss (validation loss is calculated after end of epoch and you have only one epoch). So you basically have one small point on the graph that’s there you just aren’t seeing it.
Makes sense now. Thank you so much!
Can anyone please tell me how to plot losses against epochs in a graph when I used callbacks as “” callback_fns=[BBMetrics, ShowGraph] in the learner object , i get the loss graph against no of batches processed not against number of epochs , does anyone knows a way to do this.
P.S. i have already tried using the " ```
cbs=[ShowGraphCallback()]
but it doesn't work with fast ai object detection module,it gives error while loading the function.