Sorry if this isn’t the right place to post this. Early on in the course, Jeremy mentions that you can train vision models on charts and graphs. I’m trying to test that out and I’m not having much luck.
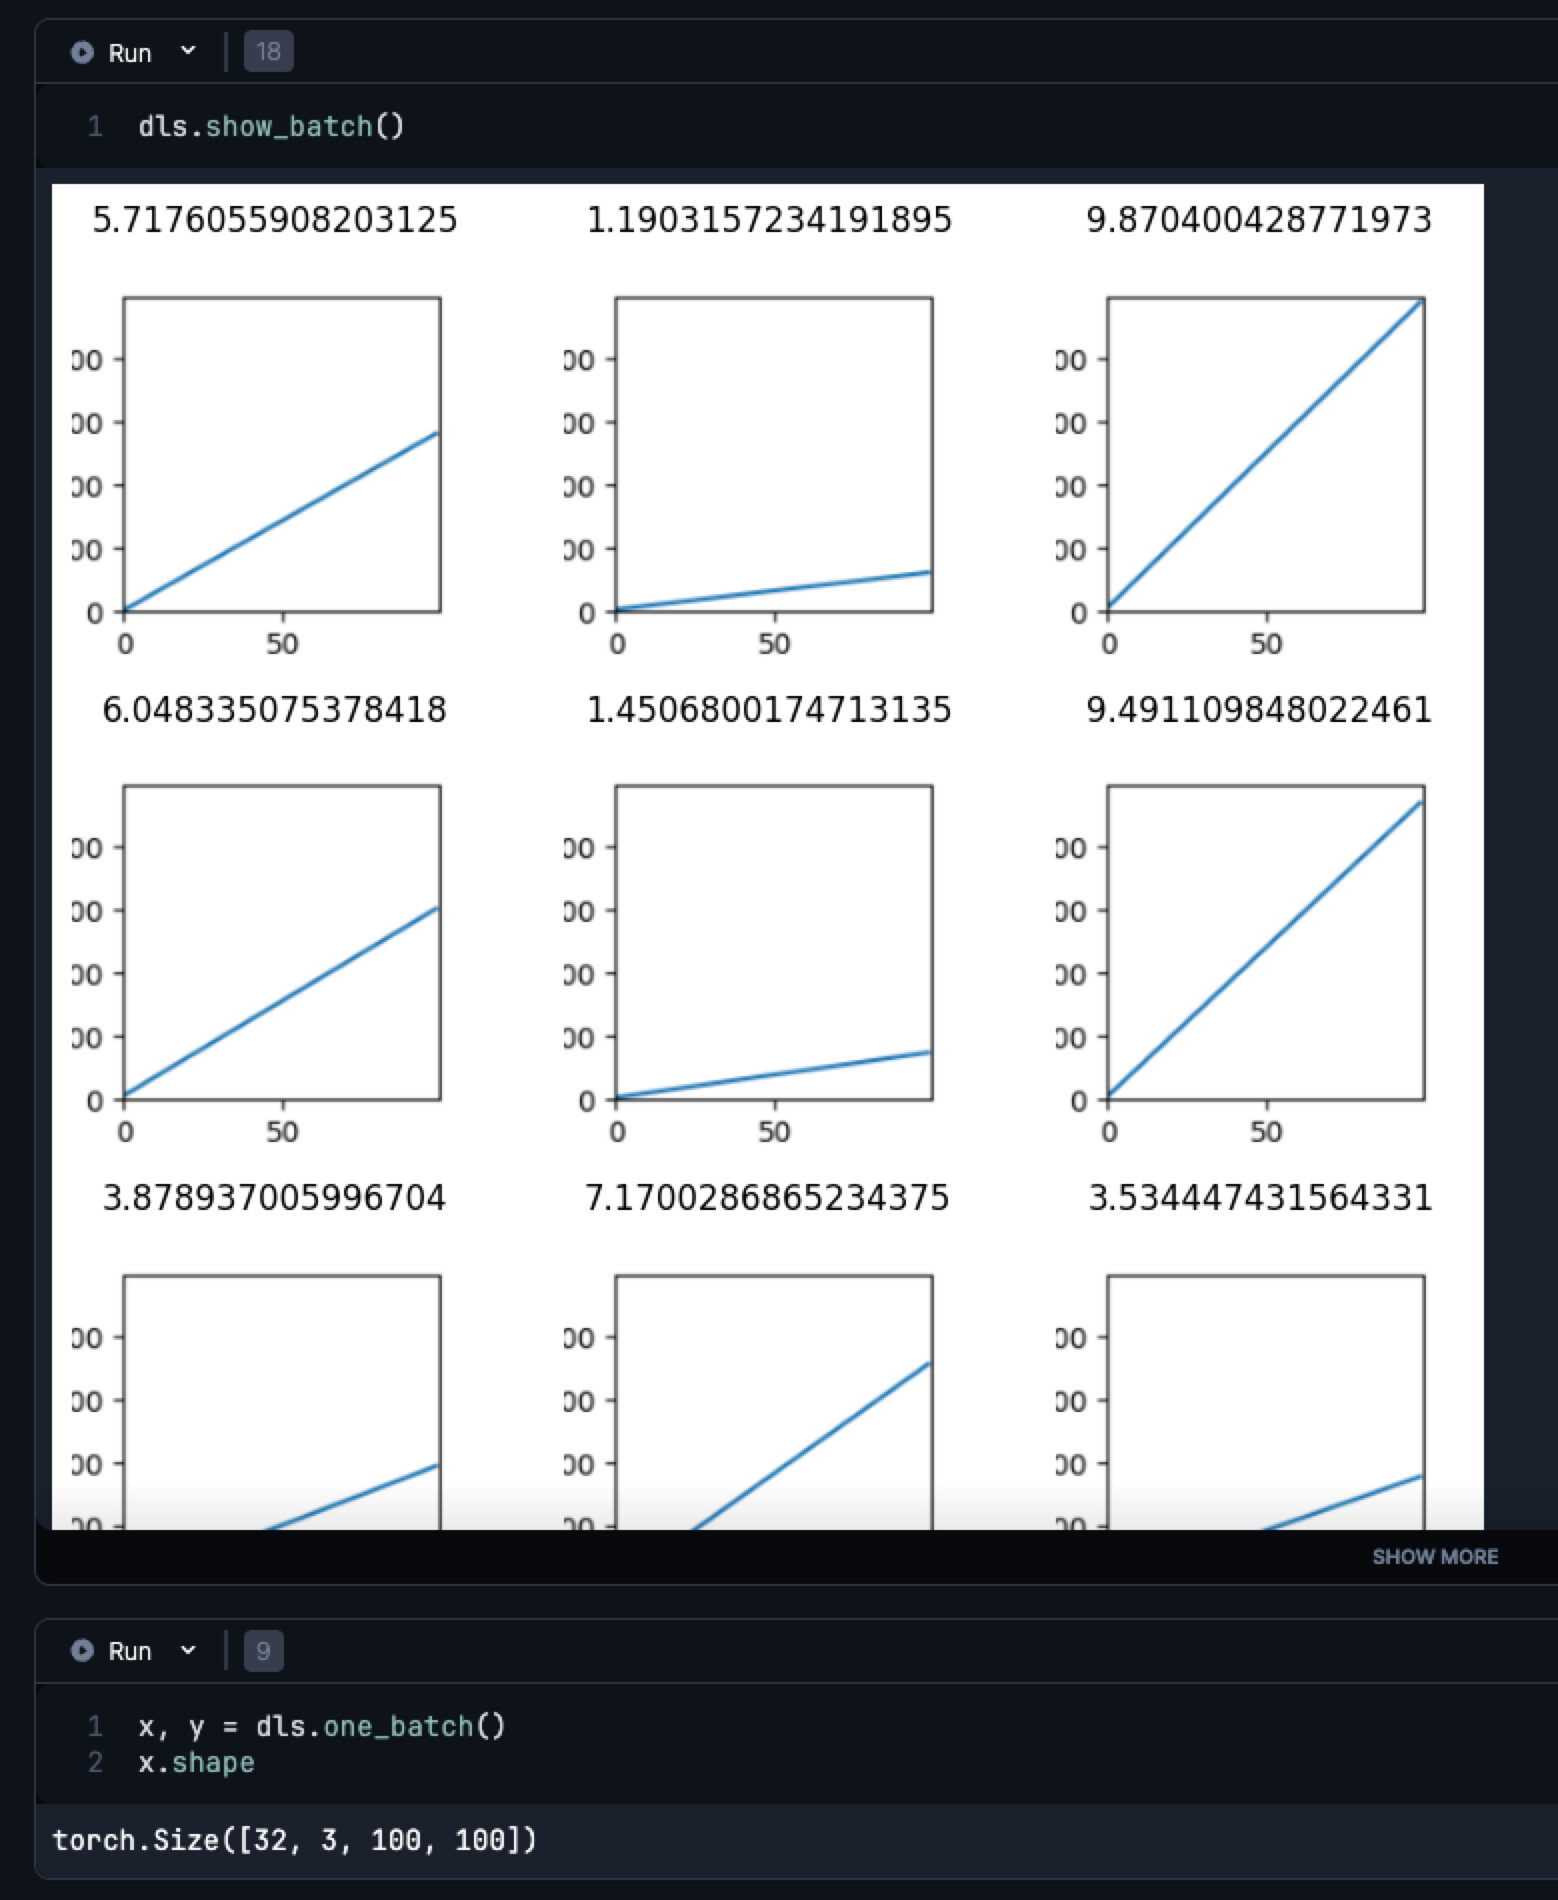
So I’m attempting to train a vision model to determine the slope of a line. I’ve created 300 line charts with 300 random slopes.
Since I’m asking the model to predict the slope of a line (i.e. a float), I think I’m should use RegressionBlock like so:
from fastai.vision.all import *

# Assuming x_data and y_data are your datasets
def get_line_chart(r): return line_charts[r]
def get_y(r): return random_slopes[r] #y_data[r]

# Define the DataBlock
dblock = DataBlock(blocks=(ImageBlock, RegressionBlock),
                   get_x=get_line_chart,
                   get_y=get_y,
                   splitter=RandomSplitter(valid_pct=0.2, seed=42),
                   item_tfms=Resize(224))


# Create DataLoaders
dls = dblock.dataloaders(range(300), bs=32)
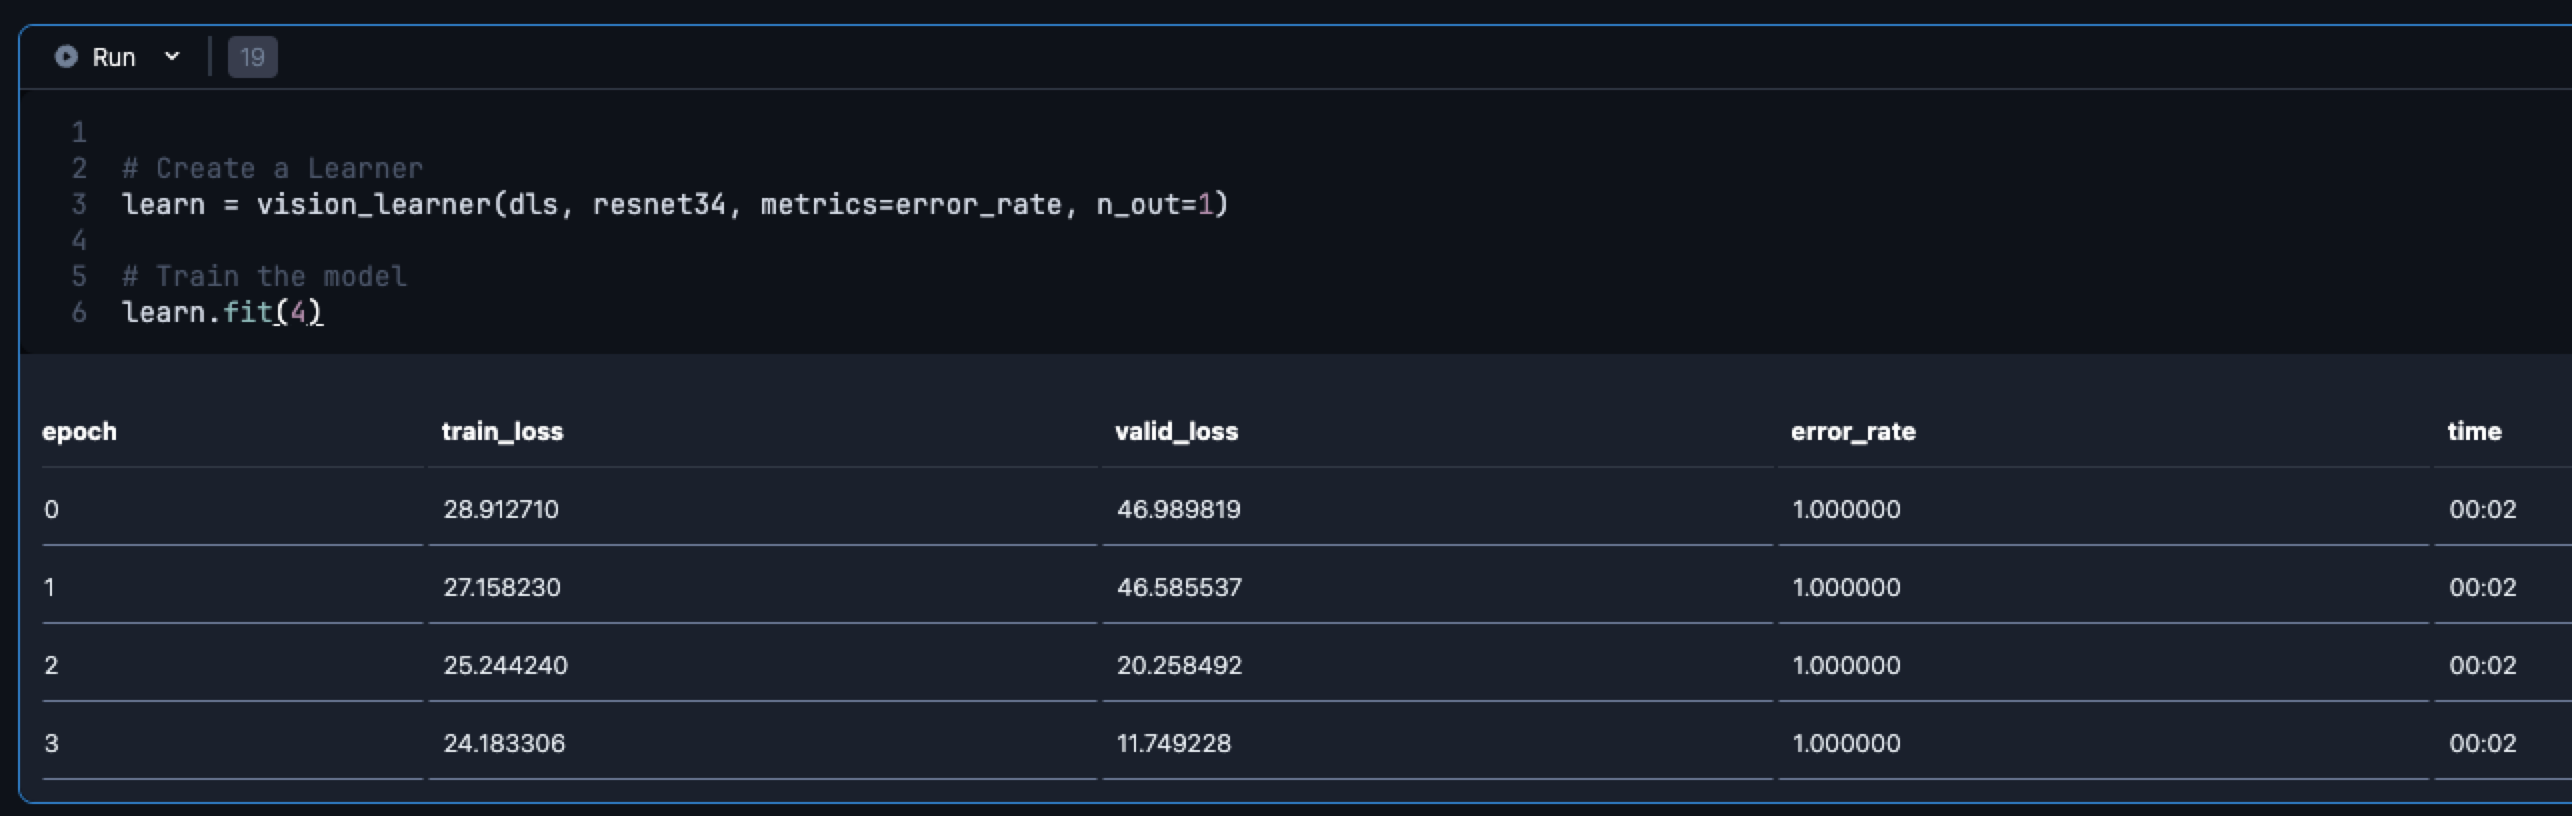
I’m creating a vision_learner and calling fit like so:
# Create a Learner
learn = vision_learner(dls, resnet34, metrics=error_rate, n_out=1)

# Train the model
learn.fit(4)
I’ve tried using fine_tune, and I’ve tried using up to 30 epochs. The error_rate never drops below 1.00000 . Sometimes the “valid_loss” gets fairly low, but the predictions aren’t very close.
Hi @frankcort ,
Interesting learning experiment. I am a beginner too.
I had tried something similar. Generated images of clocks with hour, minute and second hands.
I was able to get ok-ish accuracy for minute and second hands. Hour was not very accurate, which is understandable.
Your problem seems very similar, so I guess this should work.
My approach was also similar. ImageBlock as input. RegressionBlock as output, expcept in my case it is a tensor with 3 values for h,m,s. Almost equivalent to finding the slope of a line three times??!!
I am not able to find anything wrong in your code at first glance.
Btw, why are you doing a resize. Is that causing a change in the aspect ratio? That could change the slope, right?
Can’t think of anything else. Will look at it probably at night after work. Do post in case you are able to solve yourself.
Since you are not doing any augmentations except Resize I would guess that your 300 samples are just too few for the generalization? Use 30,000 perhaps?
@frankcort Ah. I think I got it. You are using error_rate as the metric. That is meant for classification problems. How many were classified wrongly/correctly.
Regression problems use, often, mean square error or some such. How far from the expected value is my prediction.
@Archaeologist I was able to train my analog clock model with a few hundred images. No augs.