AutoLRFinder

Please note that you can organize such ideas to be implemented via:

1 Like

that sounds like a ‘cool’ solution. Wouldn’t there be a simple 1st step (with less than perfect results) to inspect the graph and find some solid long steep slopes towards the minima? Then one gives like e.g. 3 proposals. In this 1st step it would be more to make the reading exercise from plot easier, e.g in the plot function one could mark the proposed learning rates with a colour.

What you suggest would of course be better, but harder to implement.

I guess the right way would be to record it in the fit_one_cycle, which lr was used and then record the results. As far as I can see, one wouldn’t need an explicit GUI element and submit - one could just give a default parameter that users learning rate choices get recorded with results anonymised in the back end database. Maybe additionally one could ask the user after the recording, what worked best and ask them to classify in a UI widget.

I am interested in an automated LR finder suggestion. As a start, can we just add the min gradient of the smoothed loss (it will not be perfect, but it will return something) Just two lines in basic_train.py

min_g_idx = (np.gradient(np.array([x.item() for x in losses]))).argmin()
print(f"Min numerical gradient: {lrs[min_g_idx]:.2E}") 

Output looks like this. Not a bad starting place:

image

1 Like

that would be a good start, yes.

if it does it probably should return such values, so that they can be used programmatically, instead/in addition to printing it out?

or alternatively may be the plot could do that? mark the spot and write the value next to it? or both?

just more ideas…

I will put together a PR for review with those ideas.

1 Like

Not sure about this new learn.recorder.plot() feature showing things like:

Min numerical gradient: 6.31E-07
download

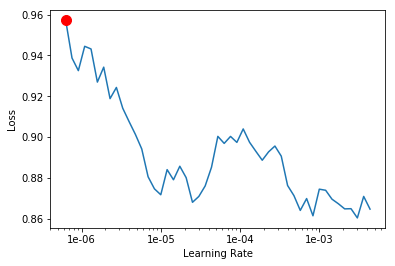
It works great on a well-behaved graph, but at times this is then not very useful, or plain misleading if someone were to use that data?

Perhaps it needs a sanity check and not display things that while mathematically correct are not useful at all?

That’s why it shouldn’t be fully trusted and the graph still shown. Maybe the printed message need to be more clear in saying it’s not always reliable.

I guess whoever folks are working on the automatic LRFinder, this would fit right in there, since you probably will have to figure it out anyway. And thank you!

This behavior mostly happens during later stages of fine tuning in my experience where the plot is not as stable as if you were just starting training. Maybe further smoothing with an alpha input parameter on top of self.losses to create a tmp smoothed losses inside .plot() method might allow users to try couple of min numerical gradients?

I’ve reproduced the phenomena: started training - interrupted it - called lr_find

Different Approaches

Original

Exponential smoothing

Fit a spline

2 Likes

Looks delightful - if it’s practical that would be very useful. For sure to build upon the current outlier graph I posted that you replied to.

1 Like

I would probably try more use cases (including yours) before considering a PR. I believe still manually observing the plot is the best approach but this may be helpful with running experiment scripts automatically. One tiny step closer to automl :slight_smile:

Or the other direction, only show the dot on the graph and print lr if there is some kind of certainty that it’s in the right range.

Interesting! Please note that the version plotted is already the smoothened version of the loss (so it’s already an exponential moving average of the loss)

2 Likes

That’s correct and I was also thinking the same: are we loosing too much info by double smoothing/fittting or would it just be fine? Only way is probably to try it many times before considering for auto lr.

1 Like

You should try the spline approach over the original set of points (the implementation of the lr finder has the problem of using a moving average to smooth the graph. This causes the resulting curve to be “late” wrt the real data).

2 Likes

The goal with spline fitting is to overcome the problems with np.gradient when lr vs loss plot is very shaky. In terms of implementation, I don’t think directly fitting spline on smoothed loss is a problem, since we are trying to find the acceptable and large learning rates on the smoothed plot rather than mistaken outliers. But, still there is no guarantee this method will cover all the edge cases.

Yes, this (shakyness) is the very reason which motivated the implementation of a moving average. But the moving average retards the plot, so I was thinking about viable alternatives.

1 Like

I found this problem quite interesting. Anyone know any existing guide on how to eye-ball these graph, with a variety of samples? I am aware these are discussed in the lesson, but it isn’t always easy to find.

I also thought the initial proposal is interesting. I am not sure if it can largely be automated. i.e. have lr_find(…) output the graph and then just search lr with multiple runs with cycles (tuning it like good old days), and empirically select the “best” lr. Thus, you can have a collection of X, Y pair to train the regression model? Do this for a large variety of models and dataset. I know this is expensive computationally, and may well be a research project. But then the “side effect” is you really know if L. Smith is largely right or wrong empirically. i.e. the proposal that the “near optimal LR” can entirely by gleaned from a plot of loss vs. the running lr.

I may well be underestimating something here…

Update: If i interprets right, L Smith never really emphasize on this, he just may have stated it as a heuristics for finding the upper bound for LR. He seemed to have used non-Hessian 2nd derivatives related method to do so in his other paper. I guess he wouldn’t care.

Also I saw there’s a PR where the spline method is used. I think this one is interesting. If it’s done over the EMA, then there will be a lag. Nevertheless, if the estimated LR is a good one, then we can just do a search around this point, and empirically determine the best LR. This may help speed up generating training pairs.

Additional thinking on the ML/DL approach.

I thought a RNN may be an alternative model than CNN. I don’t have experience with converting a time series to an image. Would the image be sensitive to the x, y scale or other visual feature. I think a combination of RNN and 1-D CNN may be a better approach.
I mean if you have CGPU to spare, combine all 3 as ensembles.

I am not sure if a paper with approx title “Learning to learn” is related to this thread. I will take a look at that paper when i get chance.

Thats a good point. EMA has a lag. I haven’t gone through code detail. This gets worse the more you smooth. Another concern is if the EMA has any “bias correction” or not. Else, the estimate will be even worse for earlier LR. This means if you fit a spline on it, the whole shape may or may not get influenced noticeably by this.

However, not sure if a spline over the raw data look?

I think this feature will be interesting to try out to see if it works better than eye balls.