Idea:- Add images/something_else across all functions in the data_block api, that shows the possible ways of how to use that function.
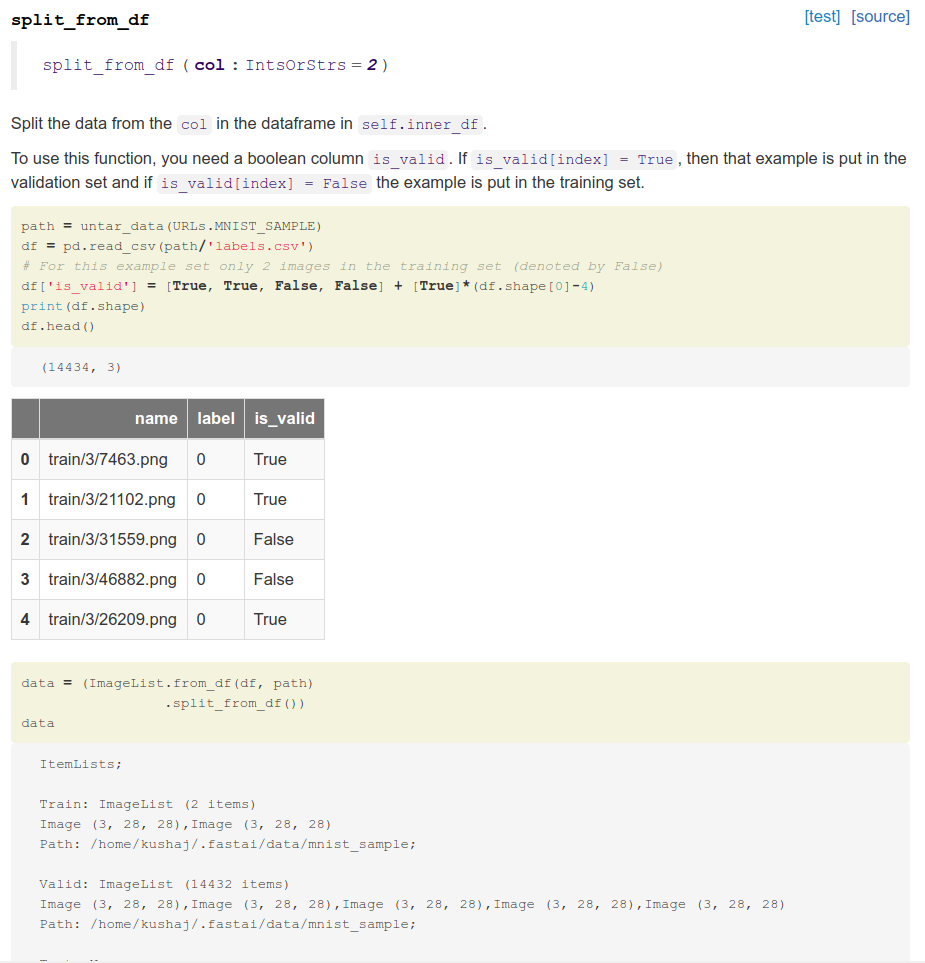
An example of what I am thinking. Consider split_from_df function, I am thinking about adding some visual context or some text that specifically shows how this function can be used.
Why:- By discussing all the functions separately, I think more information can be conveyed about when we can use data_block build in functions. And it would also provide a common place where one can look for what he is doing wrong in his own code when using the data_block api.
How:- Initially, I was thinking about doing this by adding inline code. Next, I thought about adding the required output (like dataframe image) and adding some arrow key explanation on why this function is working or just some text around the corner for easy visual context.
Any suggestion on this approach. I think I can work out most of the stuff in 2-3 days, so should I work on this. @sgugger
Below are the screenshots of the rendered version of the docs for the required function. [CHANGES] refers to the changes in the docs section I am proposing for that section.
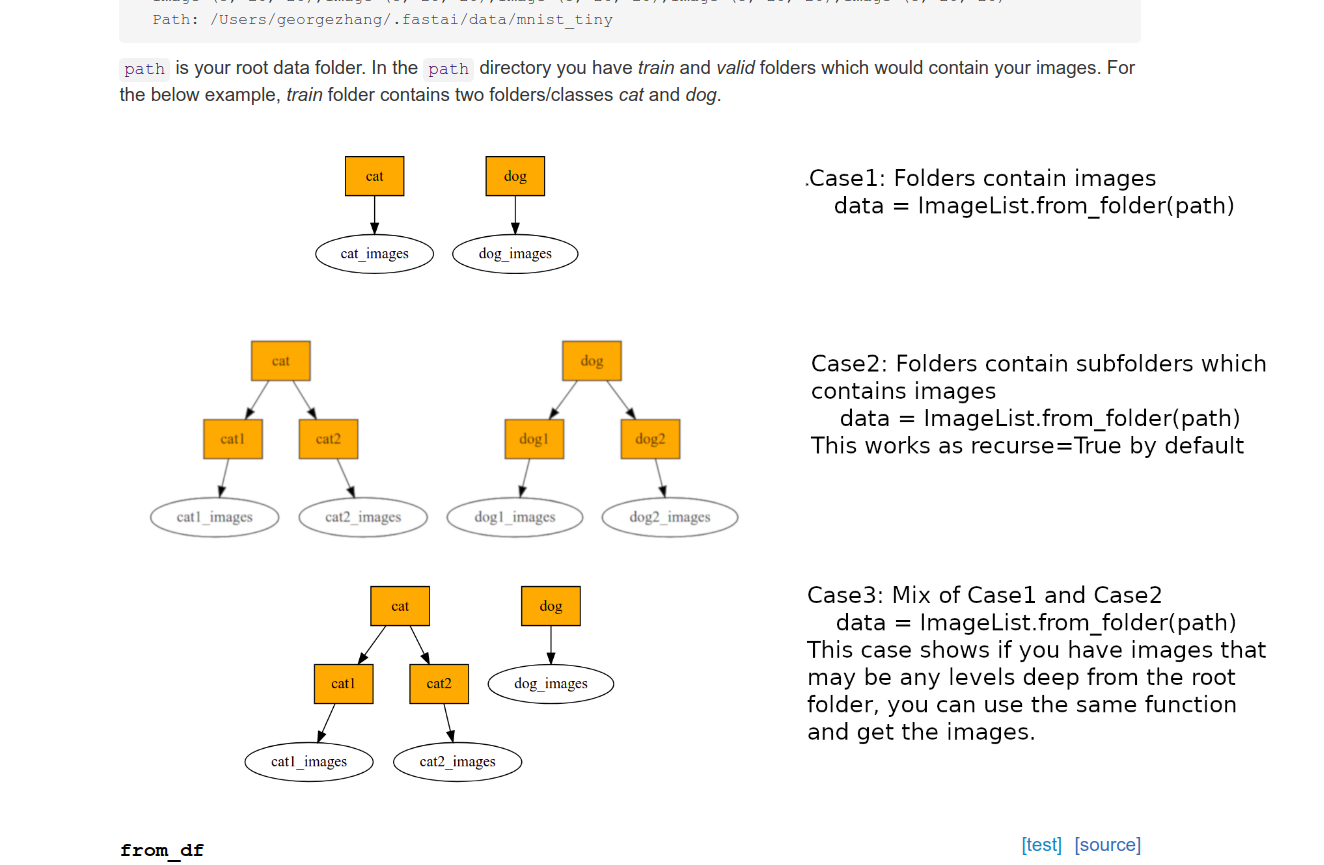
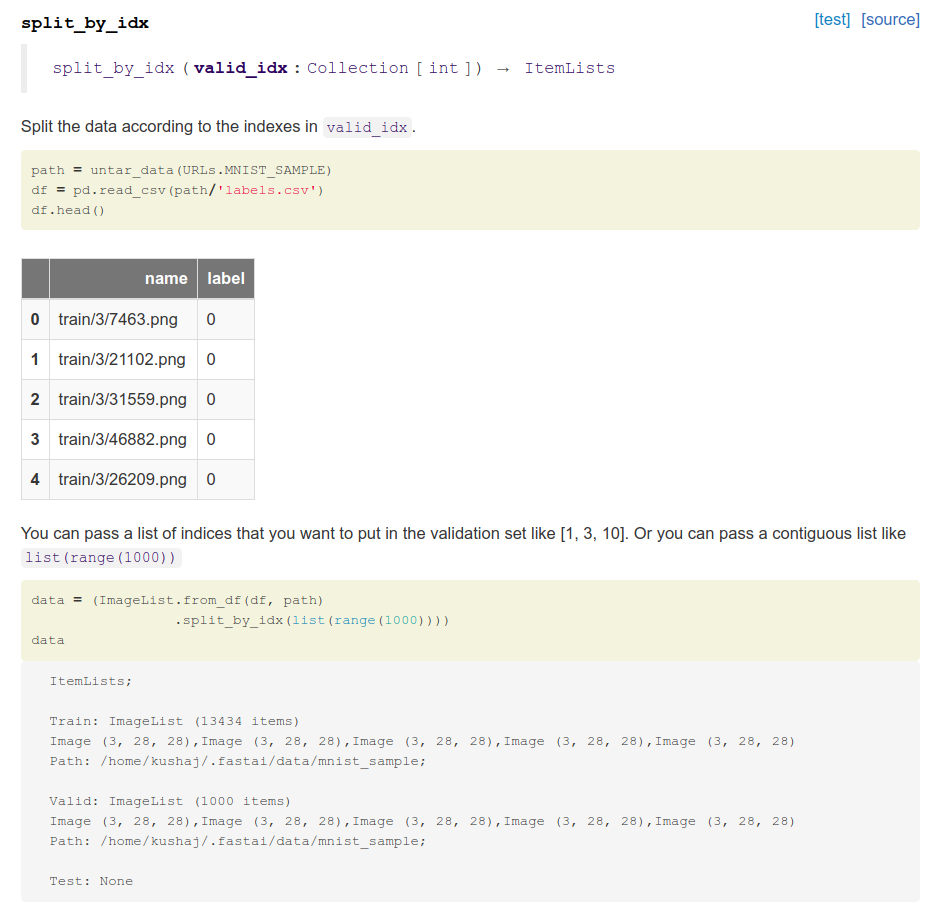
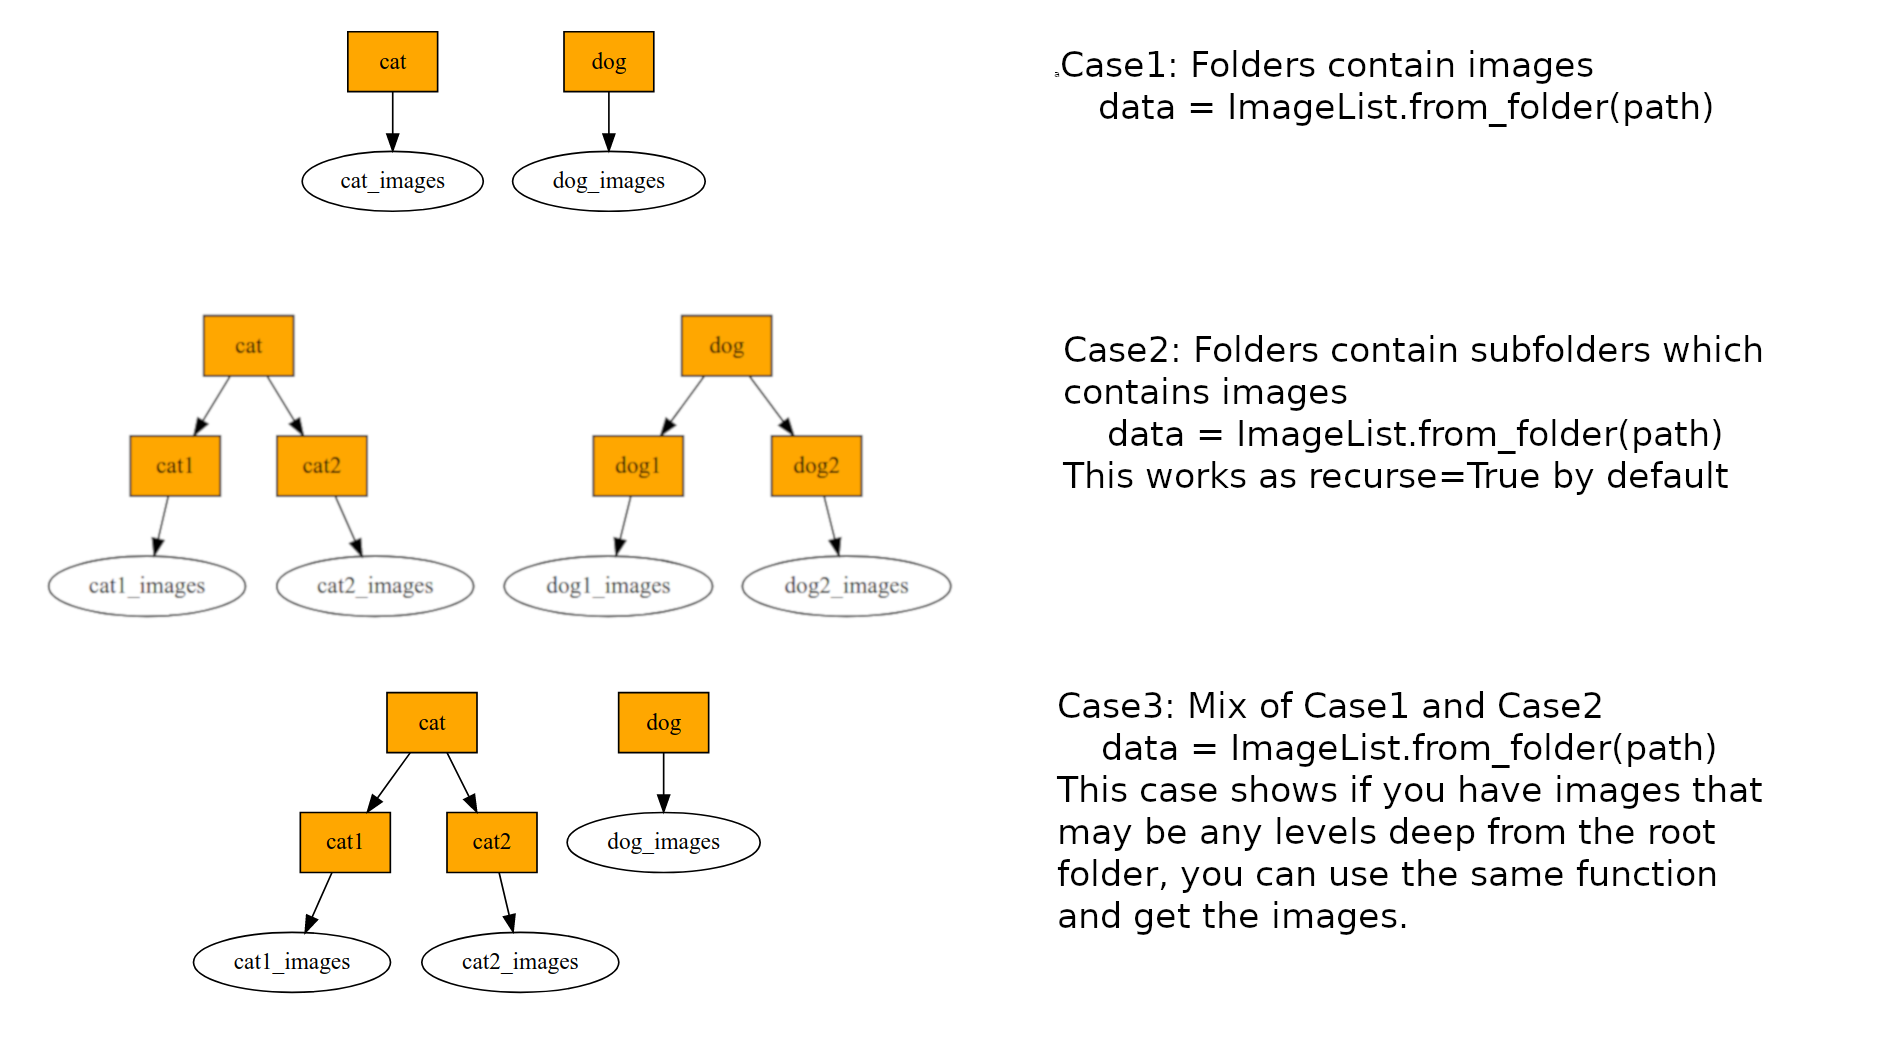
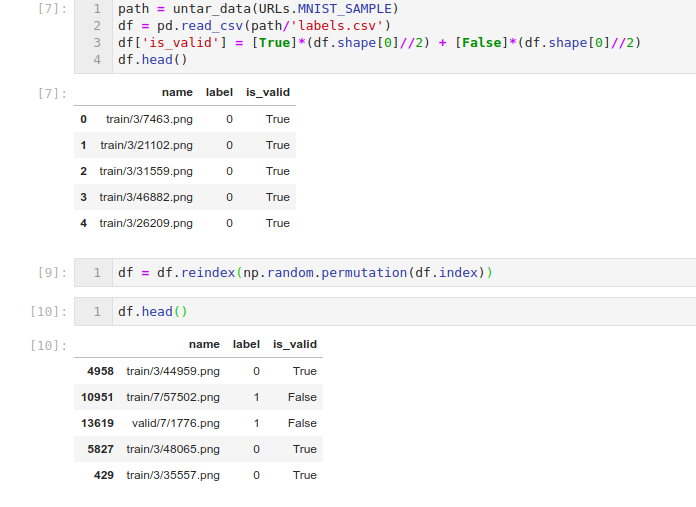
from_folder
[CHANGES] -> Added one line explaining path and added image
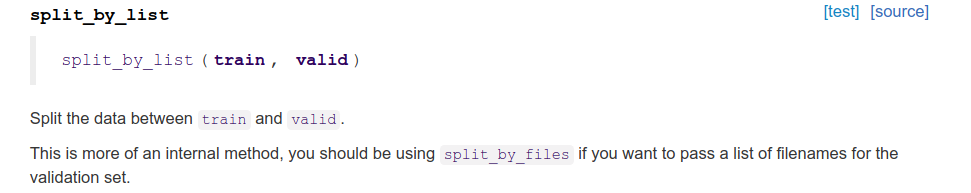
split_by_list
[CHANGES] -> Referring to this issue. I think it was confusing to use this function, as it is used mostly as an internal function. So added a line telling this.
I will make some demo and show it here. There are some functions that even I don’t know when to use.
I will update this thread with a proper formatted version, so it can be easier to see what is going on.
I made the template. So the first bullet list would contain the screenshots of the rendered html page and the second TODO list will contain a short description showing the cases where we can use that function.
I have not updated the TODO list with all the functionality right now. Would update it function by function. I think we can make this wiki post, as for some functions even I need some explanation and in that case someone can easily update the list with the use cases.
As far as how to present information. I agree that keeping things in the embedded code would make more sense. Currently, working on a blog post, would start with this project later this day.
I created a draft for from_folder. Is this the right approach for it? Right now I don’t think I would use an image for every function, as there are some functions like labeling and split functions that can be explained more easily with code example.
Feedback needed, should I do it differently or drop this approach.
There was this idea to move the useful discussions from the forums to the docs. Is this still being working on? I can work on the forums and try to migrate useful discussions or add links to forum posts in the docs. Maybe a week of work.