If you call limit_mem() again it’ll reclaim your video RAM, I believe.
Had a thought:
If you have a very large dataset, why not use the faster KMeans* algorithm first with a large number of clusters and then use MeanShift on the cluster centers?
Tried this on a lung CT with features of x,y,z position and Hounsfield units, 100 Kmeans clusters, and MeanShift bandwidth set by default by sklearn.
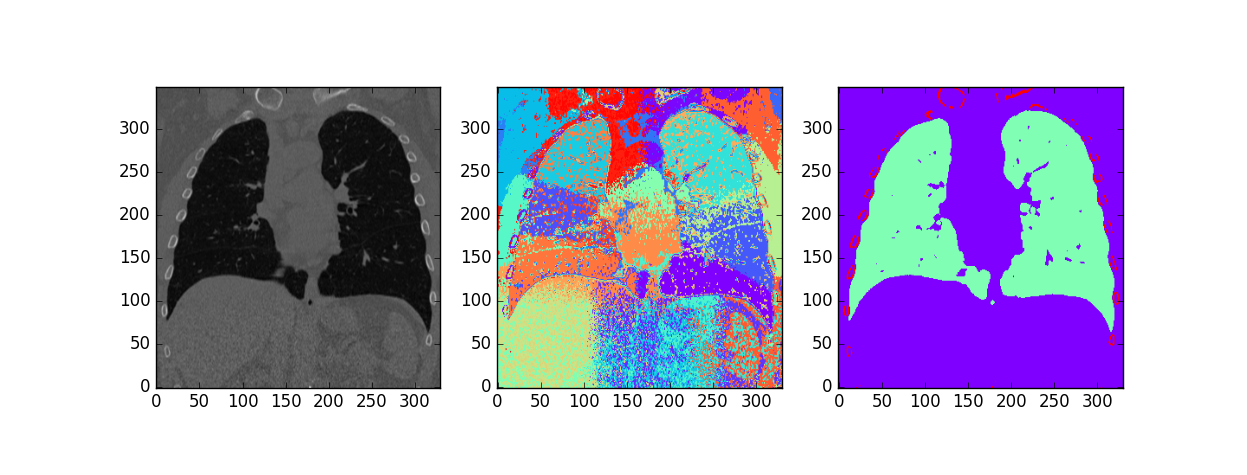
(source image, kmeans clusters, mean shift of kmeans cluster centers)
Have three parameters to tweak for this (ratio of weight of xyz coordinates to image intensity, # kmeans clusters, and meanshift bandwidth).
- Actually used MiniBatchKMeans, not KMeans.
Interesting - could you try adding the shape measure from the 5-dim meanshift lung ct paper?
Hm, the actual method they use they don’t describe in that paper, just refer to another reference I don’t have access to…
H.Yoshida and J. Nappi, “Three-dimensional computer-aided
diagnosis scheme for detection of colonic polyps,” IEEE
Trans. Medical Imaging, vol.20, no.12, pp.1261-1273, 2001.
I’m rusty on my differential forms, but I would think the measure they’re describing is more suited to surfaces than a 3D function (could be defined for any isosurface, but not sure what it means for the whole dataset). Will try to do what I think they did, but if anyone has access to that article would be very appreciative.
Here’s the paper. 01.shape_index.pdf (324.5 KB)
1 Like
@davecg I tried to read that paper over lunch, but I couldn’t understand the relevant section. Seems to be notation introduced without explanation.  Let me know if you take a look and make any progress. There are various sources cited for this calculation in the paper, but I haven’t looked them up as yet.
There are also various googlable explanations, such as http://homepages.inf.ed.ac.uk/rbf/CVonline/LOCAL_COPIES/WORTHINGTON/node6.html .
Oh, and python code! https://github.com/andersbll/ipcv/blob/master/ipcv/scalespace.py . This is linked from http://www.imm.dtu.dk/~abll/projects/shape_index_histograms/
And here’s the original paper that introduced the shape index. 0.1992.shape_index.pdf (1.3 MB)
1 Like
Wikipedia actually has pretty clear explanations for both mean curvature and Gaussian curvature.
For an isosurface F(x,y,z) == 0 (which should also work for F(x,y,z) == c for some constant):
Mean curvature:
https://wikimedia.org/api/rest_v1/media/math/render/svg/c96ea01e79b164539429cc8816a9b4130d67c962
Gaussian curvature:
https://wikimedia.org/api/rest_v1/media/math/render/svg/46cead1d6bc7103566461ebcb8b03f3a8b1347fe
The rest of the calculation of the SI is straight forward enough.
I think it will require a bit of preprocessing first because the mean curvature and gaussian curvature images look pretty noisy on raw data. Think I will try anisotropic diffusion, although all of these things together are getting pretty computationally intensive.
This does look interesting. On a resource limited computer at work right now, so couldn’t calculate hessian. The mean curvature image clearly outlines the vasculature (even on a single slice).
(row 1: gradF, row 2:source, norm(gradF), mean curvature)
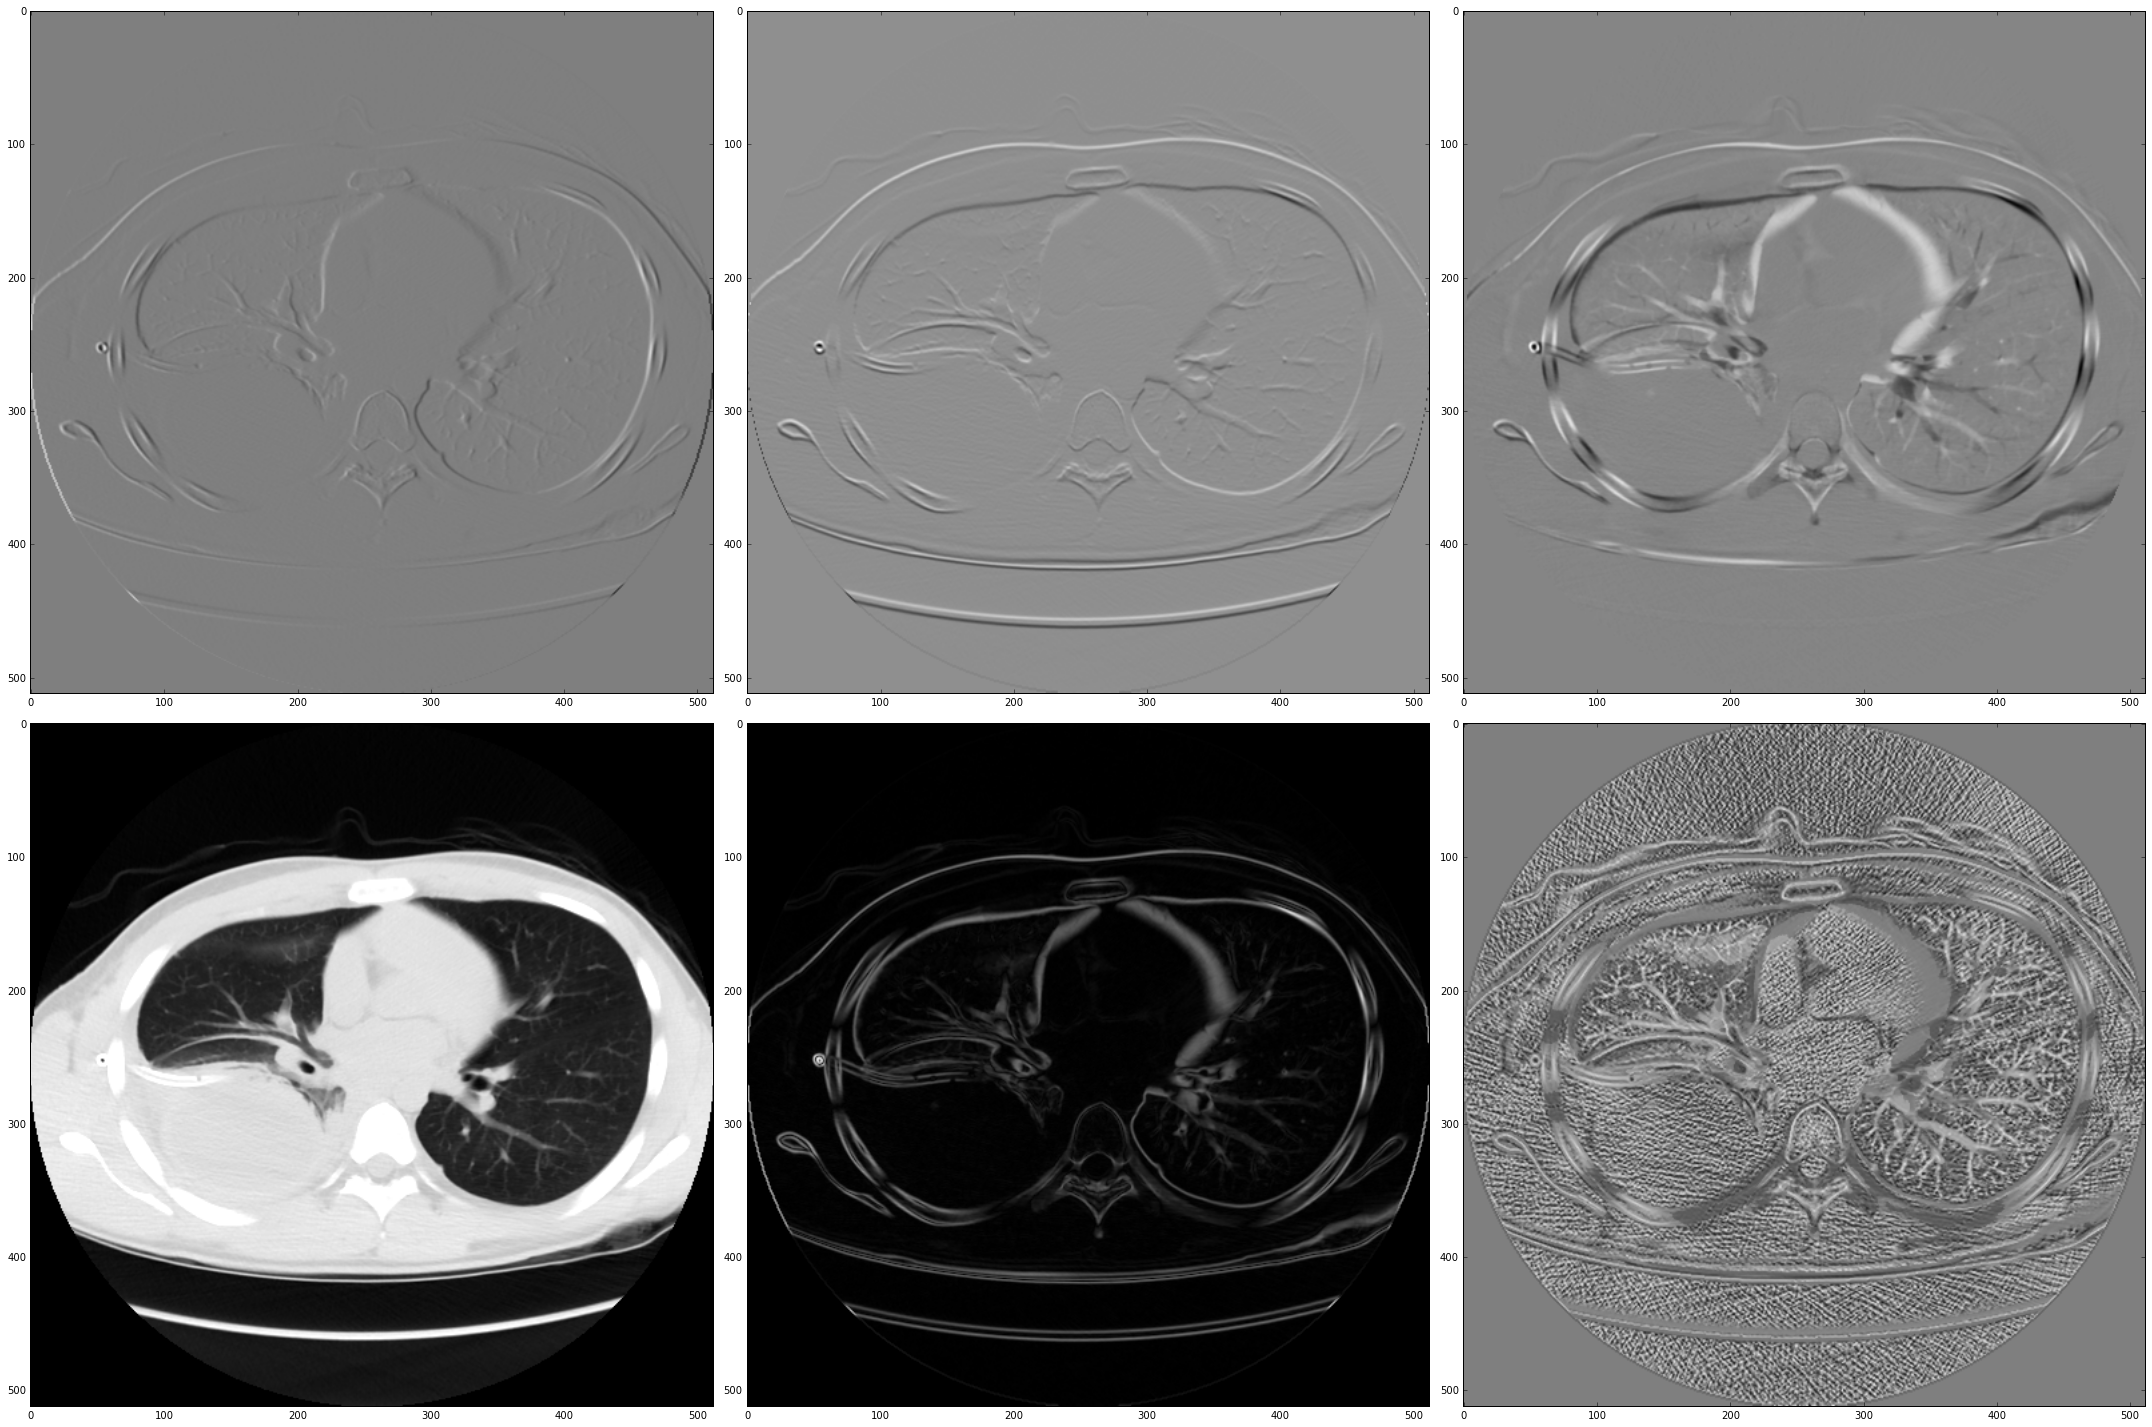
The paper I saw just used a gaussian filter preprocessing step.
If you had a simple example in python I’d be most appreciative!
I’m having some trouble with the Gaussian curvature calculation. Not sure what the issue is exactly so still troubleshooting on toy data (a sphere). Should have Gaussian curvature of 1 on the surface and 0 everywhere else.
Mean curvature works well though so far though. Just found another paper for estimating the principal curvatures of isosurfaces from grayscale data directly which might be easier (K = k1k2 and H = k1 + k2).
I’ve made a very basic version of "approximate approximate” nearest neighbor search in pytorch after learning from the LSHash lib @nima mentioned earlier. The main issues are, its performance is only comparable to kmeans when # of data points is relatively small since it’s still using a for loop. In addition, in terms of results, it doesn’t seem to be doing much better than a random draw. I’ve created a repo for anyone interested to collaborate on the project, hopefully it can be a good starting point  link to notebook
1 Like
I tried another shot at getting the gaussian curvature and I can’t get it to work. I’m guessing some kind of numerical instability issue? These are calculations from a toy dataset (sphere of 1s, everything else 0). All images are scaled from -0.25 to 0.25 except the Gaussian curvature image (K) to show the discontinuities in the result (unlike the z derivatives, the Gaussian curvature looks the same in xy, yz, and xz planes).
The calculation should be:
K = 
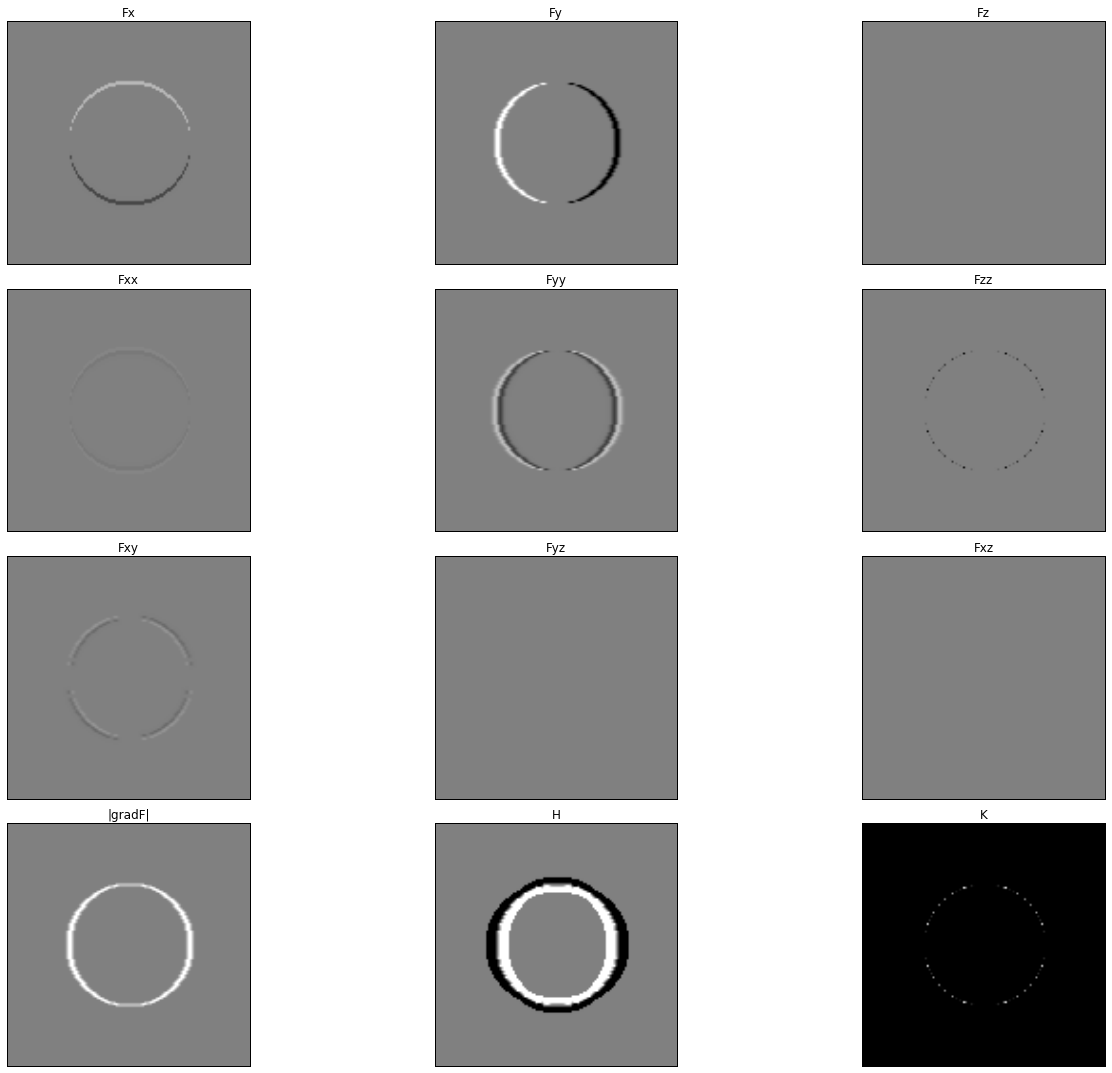
Initially I tried just simple image differences (same as np.gradient), this time I used gaussian derivatives (convolution with first derivative of gaussian in the appropriate direction). Still same issue with discontinuities in the gaussian curvature.
Aside from one general relativity course, this is getting beyond my depth, so if there’s someone with experience with differential geometry and numerical methods in physics might have better luck. 
@davecg if you can share the code you’re working with, I’d love to take a look. I don’t know what Fxx, Fxy, etc refer to, or how to calculate them, but hopefully from your code I can figure it out. Do you have any suggested reading for learning this notation?
Noticed a mistake in how I was calculating the spatial gradients and things are working a bit better now (was using (k x 1 x 1, 1 x k x 1, 1 x 1 x k) kernels instead of a k x k x k ones).
I’ll post updated results and code later today.
That notation is just a shorthand for ∂F/∂x, ∂F/∂x∂y, etc.
Figured out how to get something workable and made it in PyTorch (gaussian spatial derivatives are just convolutions, so actually really fast to calculate).
Here are some example outputs
row 1 gradient, i.e. Fx Fy Fz,
row 2 Fxx Fxy Fxz,
row 3 Fyy Fyz Fzz
row 4 mean curvature, gaussian curvature, shape index
noisy sphere:
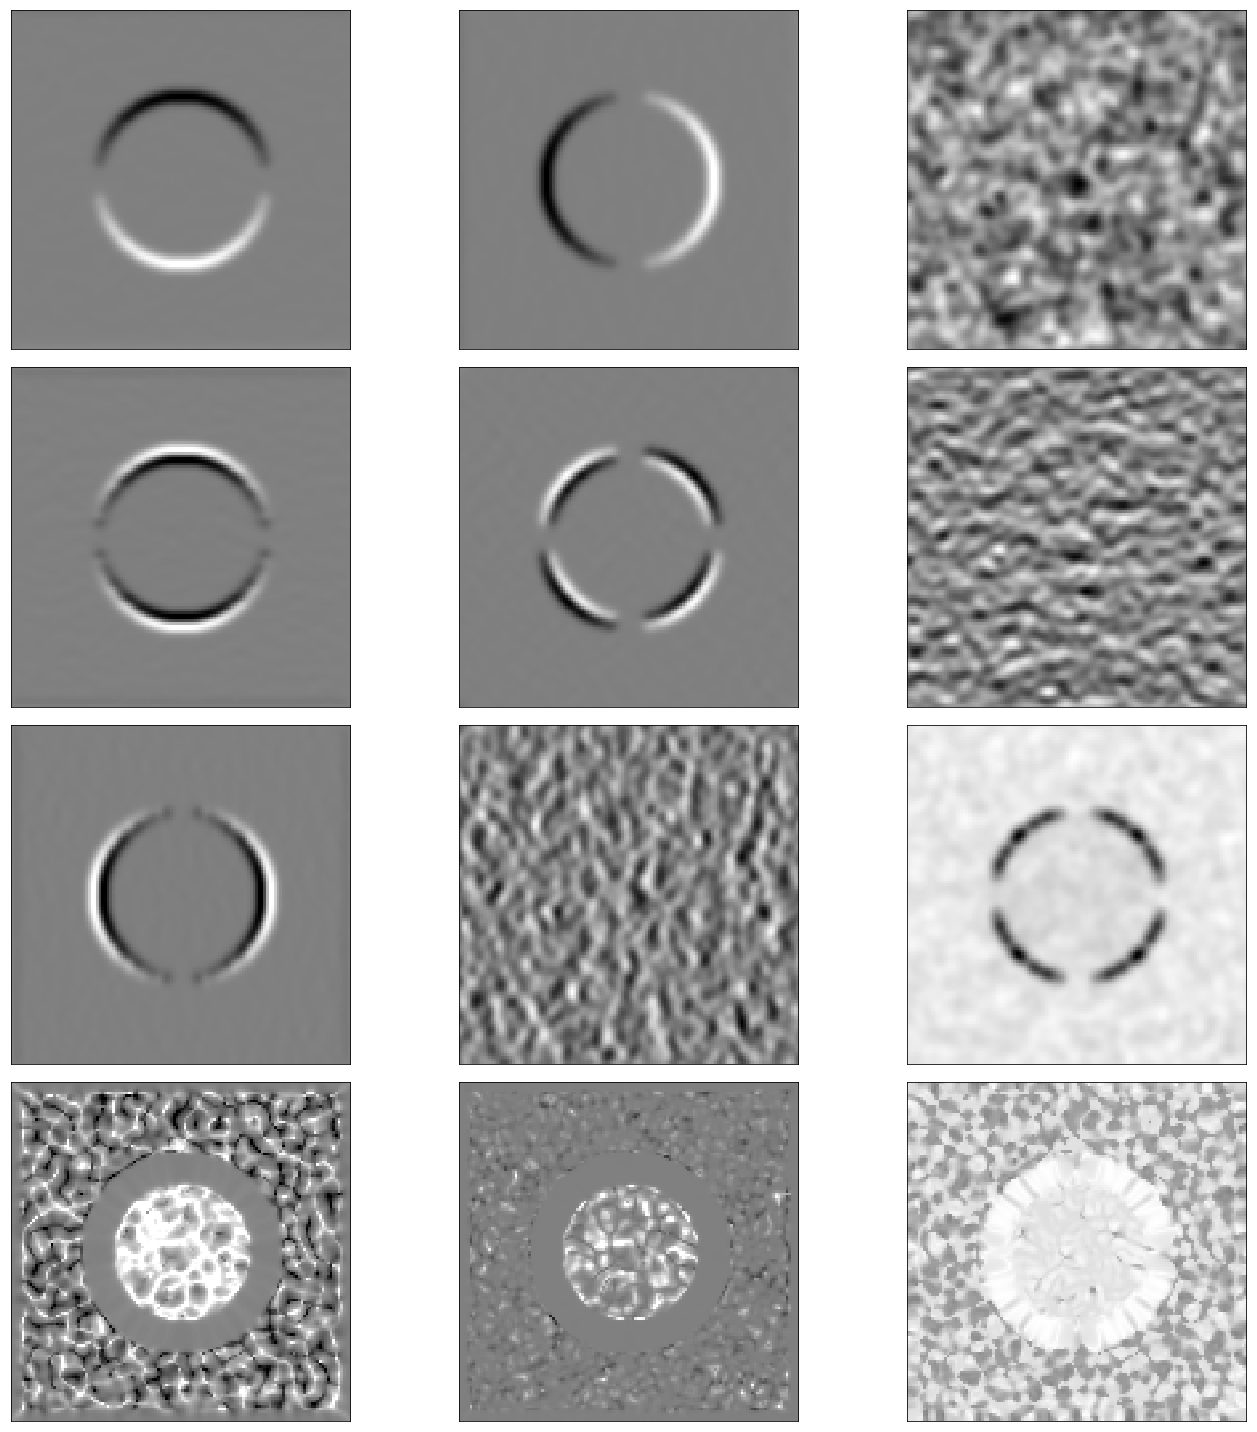
real nodule:
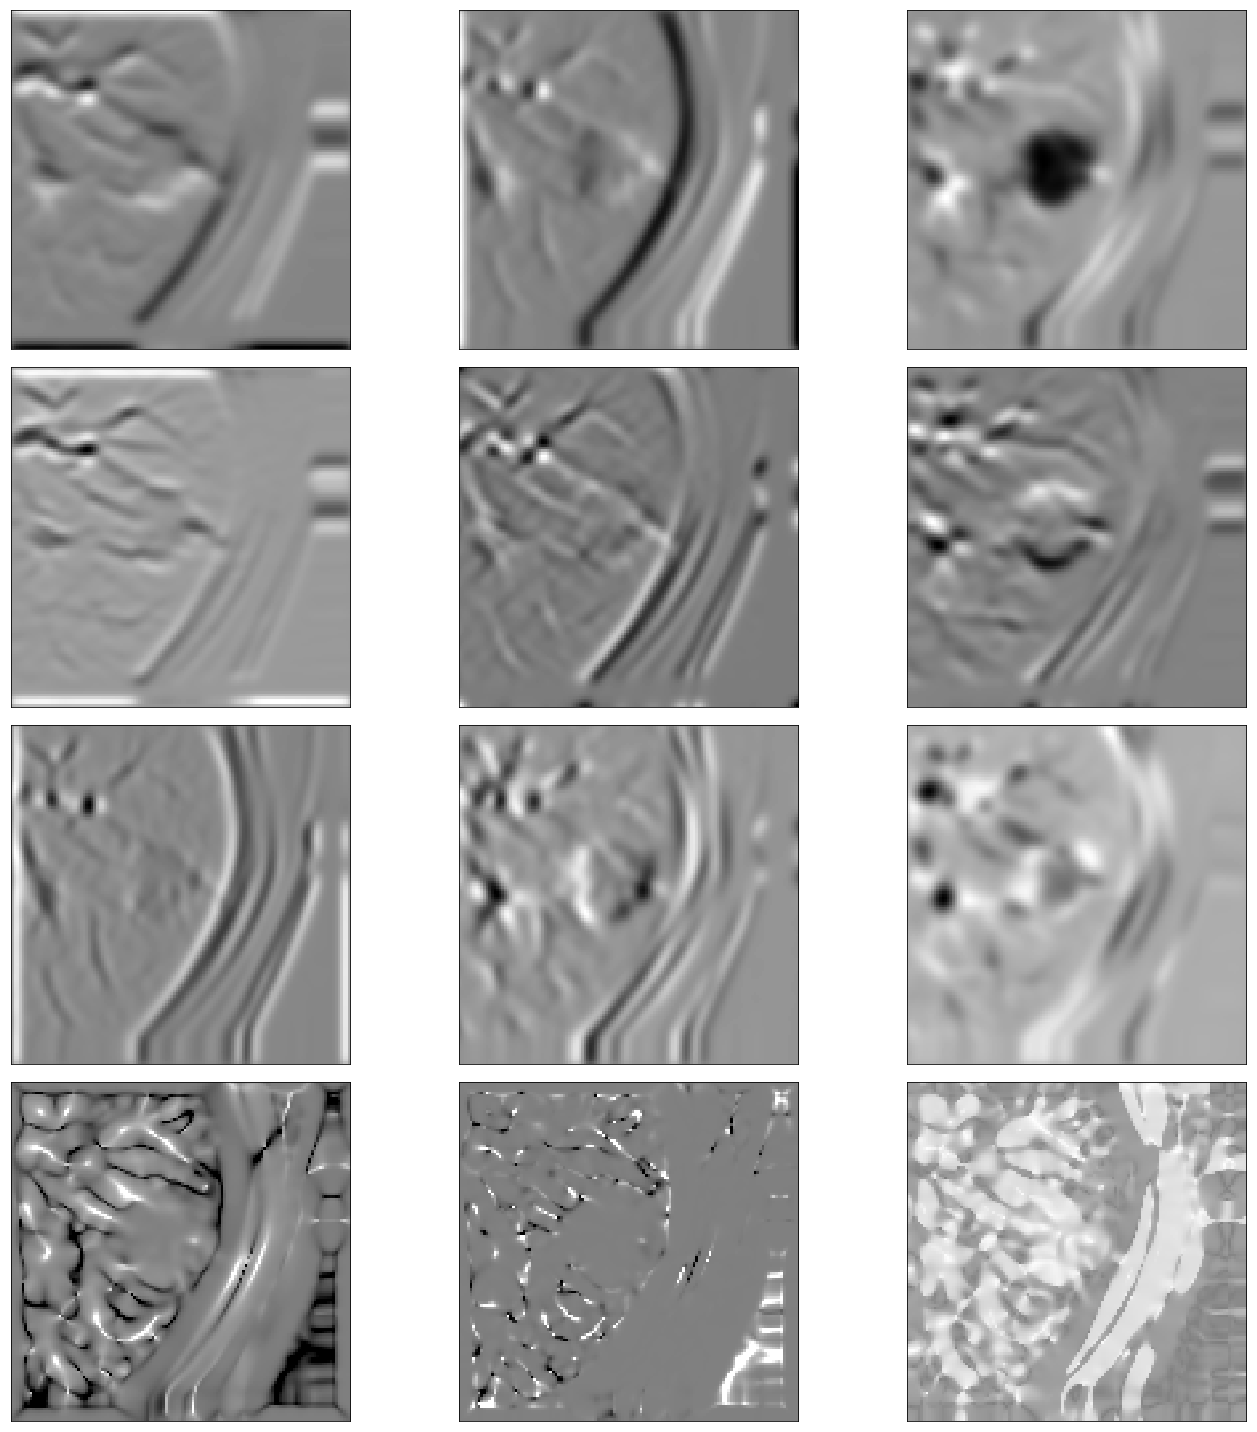
EDIT: updated images with most recent script
3 Likes
This is exciting! I’ll check this out after class finishes Monday 
My calculus is rusty, spotted a mistake in the mean curvature calculation (that’s not actually div(grad(F)/||grad(F)||), it’s just trace of the Hessian, will fix in a bit).
EDIT: Fixed, gist should work now. There’s a sign switched somewhere (?) so I had to switch the final equation to + atan(…) instead of - atan(…), but the shape index function now works.
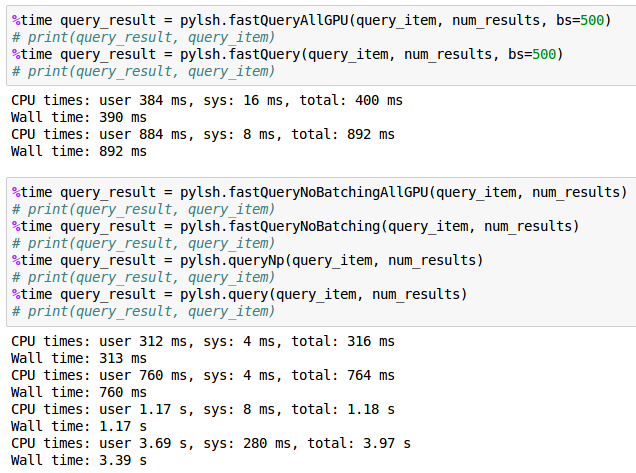
I was able to complete this LSHHash implementation. I did not get much speedup using batching than my previous implementation. I have posted my code for lshhash_torch.py and the instructions to run it are in the bottom.
In short, I implemented this in multiple stages (and function names for the respective implementation in parenthesis):
a. just get the essence of LSH function as implemented. (query)
b. port it to numpy (queryNp)
c. port it to pytorch and cuda, but no batching. (fastQueryNoBatching)
d. implement batching in pytorch (fastQuery)
e. add gpu sort and subset to batching solution (fastQueryAllGPU)
f. add gpu sort to no batching pytorch solution (fastQueryNoBatchingAllGPU).
For a particular set of input parameters (hash_size 16, input vectors size 8, num_samples 10M, num_results 2), I saw the time go from 3.39s -> 1.17s ->760ms -> 892ms -> 390ms ->312ms. Overall that is a 10x speedup. Not bad, but not great either, especially since speed up over pure numpy is only 4x.
Given that the non-batching solution was the fastest, I am inclined to think that the underlying BLAS implementation for CUDA is fast and optimized and when possible, try to do everything using BLAS as it makes your life easier as is also the fastest. No sure if this is the right takeaway though.
Hey guys, congrats to making so much progress and thanks for sharing!
I am stuck at a much more basic level: the utility file torch_utils.py is supposed to have functions like sub and mul in it for arithmetic with broadcasting in pytorch.
However, the only place where I could find it is in torch_utils.zip, lesson8, dating from Feb27th.
This file, however, appears to only contain the header, not the functions themselves. It contains
import torch
import torch.nn as nn
import torch.nn.parallel
import torch.utils.data
from torch import optim
from torch.backends import cudnn
from torchvision import datasets, transforms, utils as vutils
from torch.autograd import Variable
This may have been asked elsewhere in the forum, but I just couldn’t find it. So, apologies, if this is double-posted and I’ll be grateful for any pointer.
Oh, I found it. They are right here. Sorry, to bother you, but perhaps it’ll help someone else with the same problem.