worked on ubuntu as well. Thank you
Hello, as Jeremy mentioned to practice alot on other datasets. I tried to do it with https://www.kaggle.com/camnugent/california-housing-prices data.
However the results are quite poor. These are the steps:
df_raw.median_house_value = np.log(df_raw.median_house_value)
train_cats(df_raw)
df, y, _ = proc_df(df_raw, 'median_house_value')
n_valid = 6000
m = RandomForestRegressor(n_estimators=20, max_depth=3) %time m.fit(X_train, y_train) print_score(m)
The result is like:
[0.3588849961920751, 0.40417080529648597, 0.5900486565650618, 0.5157139520074927]
which is pretty bad. Though this is a linear regression problem but Jeremy said that random forests comes quite close to the general purpose machine learning algorithm, then why is it so bad? Did I missed something?
1 Like
@jeremy Could you please tell us if the split_vals is required? Also where can we get the complete documentation of the functions that are removed so that we can have an understanding as to the available packages in the fast.ai library. Thanks
split_vals is required to have a validation set, in this case Jeremy chose his validation set similar to that of Kaggle, which are the recent 12,000 enteries. you can choose a different validaiton set of you want, but always make sure that the validation set is fit for purpose, for example in a time series problem like the blue book for bulldozers, you always have to keep the recent entries as your validation because this is what will going to happen in the real world, for classification problems for examole make sure your validation set is balanced and truely represnts the test set and the real world at all cases.
Maybe Docker helps.
To make it work with virtualEnv (windows for me):
import os
os.environ["PATH"] += os.pathsep + 'C:\\Users\\user\\.conda\\envs\\fastai\\Library\\bin\\graphviz\\'
just only with uninstall and conda install didn’t work for me 
@peterkoman
I had the same question but Jeremy’s comment here clarified it
In lesson 2 it was said that the next split is determined by finding the feature and the split point which minimises the weighted average of the mse of the splits. Is it possible that despite a split not resulting in immediate minimum mse, will return a smaller mse on the overall tree?
Thanks for your Information, I Will try with the same data an I can tell you how it works,
If you continue practiicing with another Dataset may you can share your results with us , so we can try the same and see how it works
Best regards!
@andreist I have kind of the same results … I’m sure that I’ve not meses up something with the code …
I think may we can review all the code, And see step by step the función proc_df to understand it and see if there is something different respect to the function that Jereyme used.
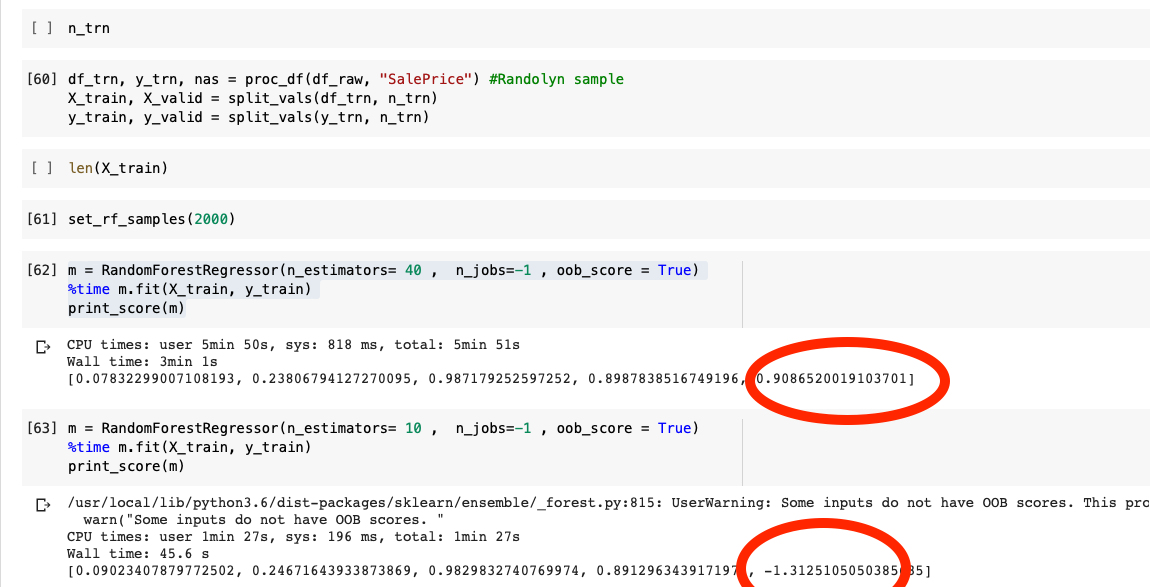
And I have differents values with the oob_score , the result are negative … different for Jeremy’s kermel ,
I have this oob_score value -.131 ( I used 10 estimators) with this Messages:
UserWarning: Some inputs do not have OOB scores. This probably means too few trees were used to compute any reliable oob estimates.
warn("Some inputs do not have OOB scores. "
And I used 40 Estimators , and I got 0.906 oob_score with 40 Trees…
Someone can Help us ?
I checked the proc_df function in the github repo at
It is calling get_samples to get the subset, and the get_sample function is actually shuffling the data. So i dont understand how is the issue rectified?
LINUX - UBUNTU
I solved this without having to install conda on my system
sudo apt-get install graphviz
this should work.
1 Like
I’m confused about what to do. I had no trouble downloading/uploading my data, but when I trained the model it had an error rate of 57%! Also, when I ran the line that says “learn.lr_find()” the results showed training losses consistently above 1.5 and the column for validation losses just read “#na#”. What does that mean? I tried changing my data sets but the problem persists. Thanks for the help!
learn.lr_find() only uses the training dataset. So don’t worry about the #na# in the validation column!
Regarding your error rate! You may be missing something- hard to tell without looking at your steps and your data. Though, sometimes the problem itself is hard for the model to classify on, so its possible you may not be able to push your efficiency beyond a point, but you can certainly improve(atleast better than 57% error)! WHat kind of data are you working on?
Cheers!
Good to know! I’m using photos of girraffes and dogs that I downloaded from google images per the lecture’s instructions. I initially thought that the problem was too hard because I was using photos of labradoodles and goldendoodles, but I had the same output when I replaced the goldendoodles with giraffes.
Oh i see. Well that’s quite a simple problem by modern deep learning standards. You should definitely expect better outcomes. How do you build your model? Have you used a proper split? Is the image labeling correct in your data? You should check everything…you’ll probably find a mistake somewhere…and having solved that your accuracy will go well above 90%!
I found inaccuracies in my image labelling. Now I have an error rate of only 2%! Thanks for the help!
1 Like