Time series/ sequential data study group

Hi @jeetkarsh,
Embeddings are used to enrich the representation of certain categorical features. With embeddings, a categorical feature with x unique values will be replaced by a matrix with min(x/2, 50) values. This means that the amount of data will be increased.

If your features are time series (I’m guessing since you’ve posted in this thread) there are alternatives to reduce the amount of data. Sampling features based on a “catalytic” event is one of them. This is an extract from Advances in Financial Machine Learning (M. López de Prado, 2018):

Suppose that you wish to predict whether the next 5% absolute return will be positive (a 5% rally) or negative (a 5% sell-off). At any random time, the accuracy of such a prediction will be low. However, if we ask a classifer to predict the sign of the next 5% absolute return after certain catalytic conditions, we are more likely to find informative features that will help us achieve a more accurate prediction.

You could, for example, create a model where you take the last 100 timesteps when the market has moved up or down a certain %. That would certainly reduce your dataset.
4 Likes

Thanks @oguiza For your detailed reply.

Has anyone try seq2seq for time series prediction?

Hi @nok, I don’t have personal experience with seq2seq models applied to time series, but it’s something that should work.
I’ve done a quick search and have found a notebook in keras (have not found anything relevant in pytorch yet). I’d be interested if you can develop something in pytorch!

1 Like

I find the same thing as well, cannot find any existing pytorch implementation yet. Btw thanks for creating this thread, I find it quite useful to have a more focus place for discussion.

I am doing a lot of searching and trying to consolidate my finding so far, in particular I am looking for

  1. Lastest algorithm that provide state of the art result
  2. Ways to create prediction interval for ML /deep learning algo.
1 Like

I am quite interested about prediction interval for ML/NN, if you know more ways to do it please let me know! This is a little summary when I reading a series of paper from Uber, basically they use dropout as bayesian approximation to create prediction interval. I couldn’t understand all the math, but practical results look good, they also win the M4 competition which require both point and interval estimate.

3 Likes

A basic Pytorch seq2seq is included into the pytorch tutorials.
I also recently stumbled upon Bayesian CNNs which could be interesting for getting the uncertainty in CNN predictions.

1 Like

Yes I am referencing a lot on the Pytorch tutorial as well, I just need more tweak to make it work for time series data.

I’m implementing this approach on the LANL earthquake competition, and there’s something that keeps bugging me…

CNNs are translation-invariant, which is a good thing normally because you can detect a dog on the left and a dog on the right equally well.

For images generated from time-series data, though, isn’t this a drawback? When our images have a clear time axis it seems like using a translation-invariant architecture would disregard that time information - a feature in the image could be recognized in the top-right or bottom-left equally well, even though those correspond to vastly different meanings (earlier vs later in the time series, for example).

Does anyone have thoughts on this? I thought that this might be the motivation for the authors of this paper using “tiled” CNNs, but as far as I can tell the tiling doesn’t seem to effect the translational invariance at all.

4 Likes

You raise an interesting point @alonso.
Translation invariance is helpful when you look for certain patterns that may occur at any point in an image. However, in certain cases, the location of the pattern may be important. This was studied by Uber AI labs, and they came up with a modified conv layer they called coordconv. They basically use the coordinates (x, y) of the image. This is the paper they published. This modified coordconv layer allows the model learn how much translation invariance is needed.
With time series, I think this may be important in some situations. There are continuous time series (like a heartbeat), where the location of certain waves in the time axis may not be important. However, in other cases (discrete time series with predefined start and end) the location of certain pattern along the time axis may be important (for example in a food spectrogram).
There is a pytorch implementation of coordconv in github link.

4 Likes

I have seen exactly this problem tackled in this paper (which is well worth a read). Essentially they solve the issue by padding only on one side of the sequence. Notice that he paper uses temporal convnets to do language modeling (which would be similar to time series predictions) without converting them into images. The architecture is quite simple. And I have seen a pytorch implementation around. I have been wanting to give it a shot for weeks, but have been caught up in other projects.

1 Like

Hi @alonso - in my experiment I found that convnet handles position sensitivity quite well - somewhat to my surprise. My positive training examples have spikes (and some dips) to the right edge of the image.

What I did have to do was to be careful with image augmentation, which is to say don’t do any at all. Given the classification task requires location sensitivity, I needed to avoid all translations, cropping/padding, flipping the image etc…

This worked out for my scenario - YMMV.

2 Likes

Translation invariance experiment
TL;DR: full translation invariance may not always be a good thing in time series problems. Uber’s CoordConv may be useful to help the help the model learn how much translation invariance is needed.

I’ve been intrigued by your same question @alonso in the last few months, so I decided to perform a small experiment to really test if translation invariance is always a good thing.
The main idea is very simple: can a nn learn that a sequence of 100 zeros with a 1 randomly assigned to a position is the position number?
For example:
x = [0, 0, 0, 1, 0, 0, …, 0, 0, 0, 0] means y = 3
x =[0, 0, 0, 0, 0, 0, …, 0, 0, 1, 0] means y = 98
x =[0, 1, 0, 0, 0, 0, …, 0, 0, 0, 0] means y = 1

This is the code to create the dataset:

n_samples = 1000
seq_len = 100
X_train = np.zeros((n_samples, seq_len))
y_train = np.empty(n_samples, dtype=int)
X_test = np.zeros((n_samples, seq_len))
y_test = np.empty(n_samples, dtype=int)
for i in range(n_samples):
    j = np.random.randint(0, seq_len)
    X_train[i, j] = 1
    y_train[i] = j
    k = np.random.randint(0, seq_len)
    X_test[i, k] = 1
    y_test[i] = k
X_train = np.expand_dims(X_train, 1)
X_test = np.expand_dims(X_test, 1)

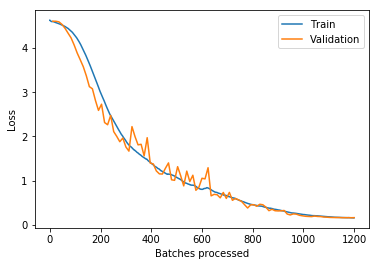
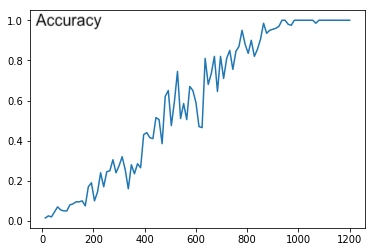
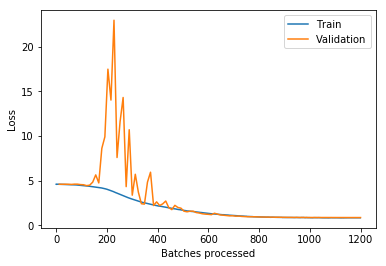
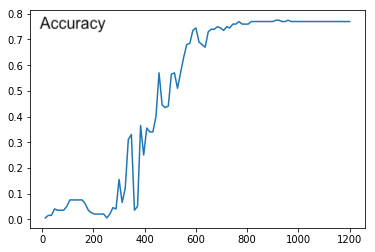
It seems a super simple problem, but even some of the state-of-the-art time series models, like ResNet or FCN (Wang, 2016), fail at this task.
For example ResNet’s accuracy on this dataset is 77% after 100 epochs.
Unknown
Unknown-2
When I use the same model (Resnet), but modify the first convolutional layer, and replace it by a CoordConv, the model achieves 100% accuracy.
Unknown-3
Unknown-4
The way I interpret this (please, let me know if you have a different view) is that a complete translation invariance may not be useful in certain types of time series (discrete or non-continuous) where the actual position of the identified features in the time axis is important.
CoordConv may be helpful in these type of situation since it

“allows networks to learn either complete translation invariance or varying degrees of translation dependence, as required by the end task”

4 Likes

Very interesting experiment.
For experimenting it is not even necessary to modify the model with the new layer, you can simply add a channel with the calculated coords to the input data!
Using this, I reproduced/confirmed your results, but I also tested your sample dataset with regression (so instead of predicting 100 classes, I try to predict the coordinate itself as one number): Without coordconv 100 epochs lead to an MAE of >4, with coordconv this is reduced to an MAE within the range of 0.1-0.3 !!

1 Like

Hi Marc,
Good to hear from you! :grinning:

Yes you are absolutely right! I just added coord as an option I can enable/disable from a conversation layer for convenience.

Great! Very interesting! This simple idea seems to definetly add value when a the position of the features identified by the conv layer have a strong temporal component. This is not the case in continuous time series.
I’ve tested the coord conv idea on other TS and it doesn’t provide any benefit. What like also like about it is that it doesn’t seem to add any negative bias.
By the way, this same idea can be applied to image data.

Yes, I saw all the examples in the paper were from image data. Maybe we should write a paper about applying it to time series! :wink:

1 Like

Hi, I find very interesting the idea to transform time series into images! I have some practical questions,
how do you handle time series with different lenghts ? (analogy to pre-padding / post padding for RNN).
And what about multivariate time series ? (for example x(t), y(t), z(t))
thanks for your insights!

It seems very interesting.can you explain the process of preparing the data ?
would it be possible to share your notebooks please ?

Greetings everyone, I’m a novice and just beginning fast ai courses, but am interested in encoding time series data visually. Has anyone tried a polar coordinate approach to plotting the time series? I am working with repeat multispectral satellite imagery. The different colored facets each represent a different wavelength of light, and the magnitude of theta the reflectance. Time proceeds clockwise from the top of the plot. 558_20160623_ribbon

My thinking in trying a polar approach is that we might be able to take advantage of rotational data augmentation to help the models generalize.

Does anyone have advice on the value of representing different dimensions of the time series as facets in a plot?

2 Likes

great group! I have the drivendata’s Cold start data where i performed quite well, I have read the paper on encoding time series as images and i want to try, also i’m thinking to join the VBS kaggle competition

1 Like